Basic Stats
| Portfolio Value | $ 542,765,686 |
| Current Positions | 24 |
Latest Holdings, Performance, AUM (from 13F, 13D)
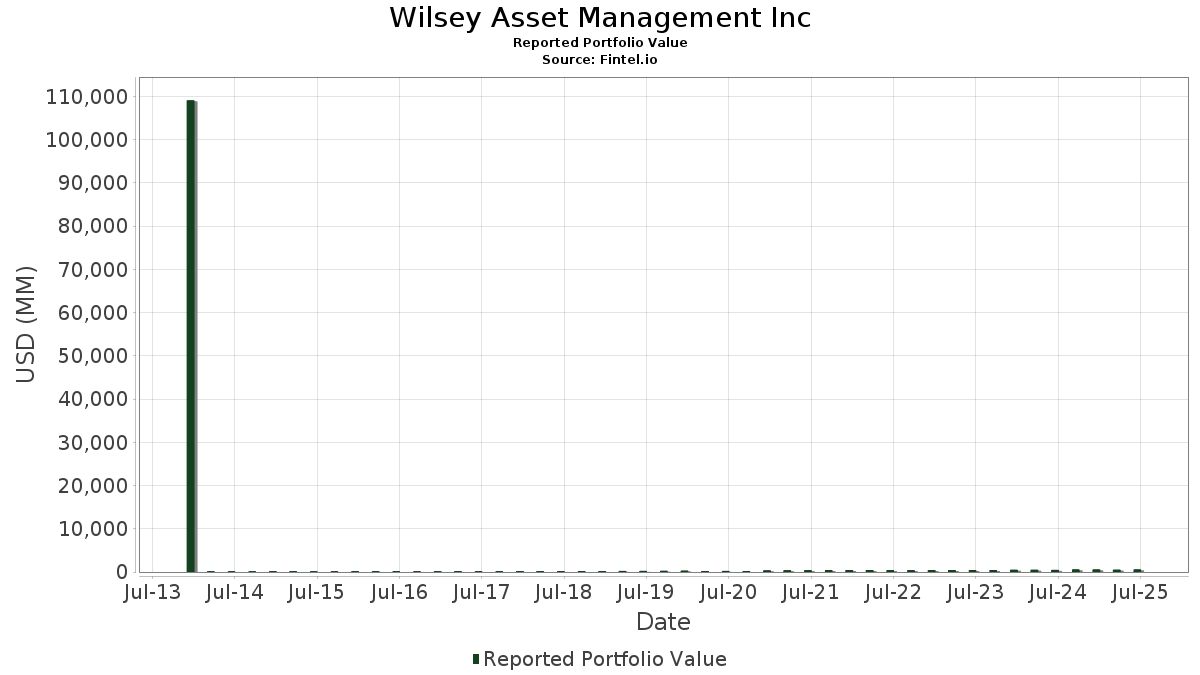
Wilsey Asset Management Inc has disclosed 24 total holdings in their latest SEC filings. Most recent portfolio value is calculated to be $ 542,765,686 USD. Actual Assets Under Management (AUM) is this value plus cash (which is not disclosed). Wilsey Asset Management Inc’s top holdings are Microsoft Corporation (US:MSFT) , Wells Fargo & Company (US:WFC) , JPMorgan Chase & Co. (US:JPM) , The Allstate Corporation (US:ALL) , and Tapestry, Inc. (US:TPR) . Wilsey Asset Management Inc’s new positions include Stanley Black & Decker, Inc. (US:SWK) , .
Top Increases This Quarter
We use the change in the portfolio allocation because this is the most meaningful metric. Changes can be due to trades or changes in share prices.
| Security | Shares (MM) |
Value (MM$) |
Portfolio % | ΔPortfolio % |
|---|---|---|---|---|
| 0.51 | 34.29 | 6.3183 | 6.3183 | |
| 0.11 | 55.41 | 10.2082 | 1.8284 | |
| 0.40 | 34.91 | 6.4315 | 0.7661 | |
| 0.14 | 41.73 | 7.6880 | 0.6009 | |
| 0.61 | 48.66 | 8.9651 | 0.2049 | |
| 0.00 | 0.29 | 0.0543 | 0.0117 | |
| 0.00 | 0.35 | 0.0639 | 0.0044 |
Top Decreases This Quarter
We use the change in the portfolio allocation because this is the most meaningful metric. Changes can be due to trades or changes in share prices.
| Security | Shares (MM) |
Value (MM$) |
Portfolio % | ΔPortfolio % |
|---|---|---|---|---|
| 0.56 | 27.10 | 4.9922 | -1.7750 | |
| 4.93 | 21.24 | 3.9129 | -1.7022 | |
| 0.20 | 28.95 | 5.3336 | -1.3938 | |
| 0.17 | 34.99 | 6.4460 | -0.6769 | |
| 0.11 | 26.09 | 4.8071 | -0.6089 | |
| 0.12 | 1.57 | 0.2884 | -0.5836 | |
| 0.21 | 22.53 | 4.1516 | -0.5616 | |
| 4.12 | 30.00 | 5.5273 | -0.3985 | |
| 0.96 | 31.22 | 5.7519 | -0.3939 | |
| 0.99 | 23.88 | 4.4003 | -0.3826 |
13F and Fund Filings
This form was filed on 2025-07-15 for the reporting period 2025-06-30. Click the link icon to see the full transaction history.
Upgrade to unlock premium data and export to Excel ![]() .
.
| Security | Type | Avg Share Price | Shares (MM) |
ΔShares (%) |
ΔShares (%) |
Value ($MM) |
Portfolio (%) |
ΔPortfolio (%) |
|
|---|---|---|---|---|---|---|---|---|---|
| MSFT / Microsoft Corporation | 0.11 | 0.01 | 55.41 | 32.52 | 10.2082 | 1.8284 | |||
| WFC / Wells Fargo & Company | 0.61 | -0.24 | 48.66 | 11.33 | 8.9651 | 0.2049 | |||
| JPM / JPMorgan Chase & Co. | 0.14 | -0.15 | 41.73 | 18.01 | 7.6880 | 0.6009 | |||
| ALL / The Allstate Corporation | 0.17 | 1.26 | 34.99 | -1.55 | 6.4460 | -0.6769 | |||
| TPR / Tapestry, Inc. | 0.40 | -0.98 | 34.91 | 23.50 | 6.4315 | 0.7661 | |||
| SWK / Stanley Black & Decker, Inc. | 0.51 | 34.29 | 6.3183 | 6.3183 | |||||
| CI / The Cigna Group | 0.10 | 2.87 | 33.70 | 3.37 | 6.2085 | -0.3255 | |||
| GM / General Motors Company | 0.65 | -0.86 | 31.96 | 3.74 | 5.8888 | -0.2865 | |||
| VICI / VICI Properties Inc. | 0.96 | 1.88 | 31.22 | 1.81 | 5.7519 | -0.3939 | |||
| PDM / Piedmont Realty Trust, Inc. | 4.12 | 2.58 | 30.00 | 1.47 | 5.5273 | -0.3985 | |||
| CVX / Chevron Corporation | 0.20 | 0.76 | 28.95 | -13.75 | 5.3336 | -1.3938 | |||
| TAP / Molson Coors Beverage Company | 0.56 | 1.58 | 27.10 | -19.75 | 4.9922 | -1.7750 | |||
| FDX / FedEx Corporation | 0.11 | 3.55 | 26.09 | -3.45 | 4.8071 | -0.6089 | |||
| PFE / Pfizer Inc. | 0.99 | 4.63 | 23.88 | 0.08 | 4.4003 | -0.3826 | |||
| MHK / Mohawk Industries, Inc. | 0.21 | 4.36 | 22.53 | -4.18 | 4.1516 | -0.5616 | |||
| MPW / Medical Properties Trust, Inc. | 4.93 | 6.06 | 21.24 | -24.19 | 3.9129 | -1.7022 | |||
| COST / Costco Wholesale Corporation | 0.01 | -0.20 | 12.57 | 4.46 | 2.3152 | -0.0960 | |||
| PARA / Paramount Global | 0.12 | -66.64 | 1.57 | -64.02 | 0.2884 | -0.5836 | |||
| QCOM / QUALCOMM Incorporated | 0.00 | -5.38 | 0.45 | -1.98 | 0.0821 | -0.0089 | |||
| VLO / Valero Energy Corporation | 0.00 | -34.99 | 0.44 | -33.78 | 0.0816 | -0.0526 | |||
| LDOS / Leidos Holdings, Inc. | 0.00 | 0.00 | 0.35 | 16.89 | 0.0639 | 0.0044 | |||
| WLDN / Willdan Group, Inc. | 0.00 | -9.76 | 0.29 | 38.68 | 0.0543 | 0.0117 | |||
| SAIC / Science Applications International Corporation | 0.00 | 0.00 | 0.23 | 0.00 | 0.0427 | -0.0036 | |||
| V / Visa Inc. | 0.00 | 1.32 | 0.22 | 2.83 | 0.0402 | -0.0024 | |||
| PYPL / PayPal Holdings, Inc. | 0.00 | -100.00 | 0.00 | 0.0000 |