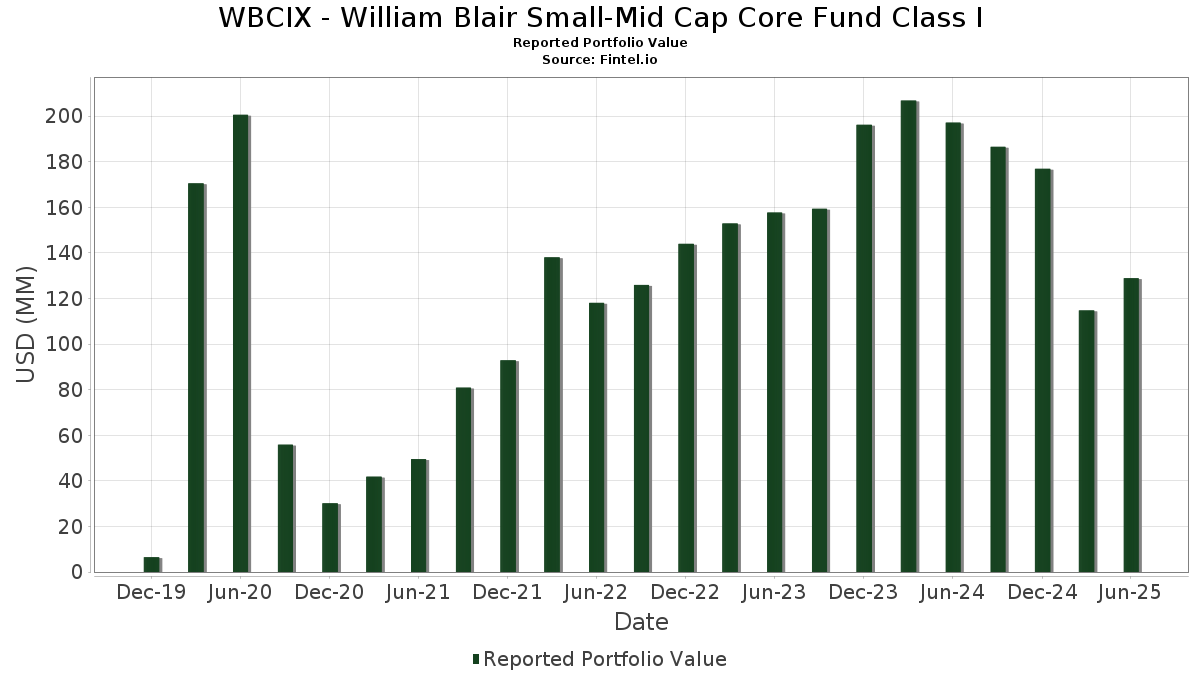
Basic Stats
| Portfolio Value | $ 128,909,550 |
| Current Positions | 87 |
Latest Holdings, Performance, AUM (from 13F, 13D)
WBCIX - William Blair Small-Mid Cap Core Fund Class I has disclosed 87 total holdings in their latest SEC filings. Most recent portfolio value is calculated to be $ 128,909,550 USD. Actual Assets Under Management (AUM) is this value plus cash (which is not disclosed). WBCIX - William Blair Small-Mid Cap Core Fund Class I’s top holdings are Talen Energy Corporation (US:TLN) , The Baldwin Insurance Group, Inc. (US:BWIN) , Everest Group, Ltd. (US:EG) , CACI International Inc (US:CACI) , and Primo Brands Corporation (US:PRMB) . WBCIX - William Blair Small-Mid Cap Core Fund Class I’s new positions include Gogo Inc. (US:GOGO) , Coherent Corp. (US:COHR) , Maplebear Inc. (US:CART) , UL Solutions Inc. (US:ULS) , and Carpenter Technology Corporation (US:CRS) .
Top Increases This Quarter
We use the change in the portfolio allocation because this is the most meaningful metric. Changes can be due to trades or changes in share prices.
| Security | Shares (MM) |
Value (MM$) |
Portfolio % | ΔPortfolio % |
|---|---|---|---|---|
| 2.88 | 2.2316 | 2.2316 | ||
| 0.12 | 1.83 | 1.4187 | 1.4187 | |
| 0.02 | 1.77 | 1.3724 | 1.3724 | |
| 0.01 | 1.71 | 1.3292 | 1.3292 | |
| 0.04 | 1.62 | 1.2591 | 1.2591 | |
| 0.02 | 1.48 | 1.1487 | 1.1487 | |
| 0.01 | 1.44 | 1.1171 | 1.1171 | |
| 0.01 | 1.23 | 0.9516 | 0.9516 | |
| 0.03 | 1.08 | 0.8370 | 0.8370 | |
| 0.02 | 1.03 | 0.8016 | 0.8016 |
Top Decreases This Quarter
We use the change in the portfolio allocation because this is the most meaningful metric. Changes can be due to trades or changes in share prices.
| Security | Shares (MM) |
Value (MM$) |
Portfolio % | ΔPortfolio % |
|---|---|---|---|---|
| 0.06 | 1.08 | 0.8340 | -1.0487 | |
| 0.02 | 1.28 | 0.9912 | -0.9890 | |
| 0.02 | 1.95 | 1.5090 | -0.8158 | |
| 0.00 | 1.84 | 1.4309 | -0.7317 | |
| 0.00 | 0.00 | -0.7276 | ||
| 0.02 | 0.63 | 0.4851 | -0.6920 | |
| 0.03 | 1.26 | 0.9758 | -0.6084 | |
| 0.02 | 0.12 | 0.0910 | -0.5786 | |
| 0.05 | 2.34 | 1.8133 | -0.5137 | |
| 0.00 | 0.77 | 0.5950 | -0.4868 |
13F and Fund Filings
This form was filed on 2025-08-20 for the reporting period 2025-06-30. Click the link icon to see the full transaction history.
Upgrade to unlock premium data and export to Excel ![]() .
.
| Security | Type | Avg Share Price | Shares (MM) |
ΔShares (%) |
ΔShares (%) |
Value ($MM) |
Portfolio (%) |
ΔPortfolio (%) |
|
|---|---|---|---|---|---|---|---|---|---|
| FIXED INC CLEARING CORP.REPO / RA (000000000) | 2.88 | 2.2316 | 2.2316 | ||||||
| TLN / Talen Energy Corporation | 0.01 | 7.04 | 2.81 | 55.86 | 2.1783 | 0.6088 | |||
| BWIN / The Baldwin Insurance Group, Inc. | 0.06 | 7.04 | 2.58 | 2.55 | 1.9976 | -0.1903 | |||
| EG / Everest Group, Ltd. | 0.01 | 17.27 | 2.57 | 9.71 | 1.9911 | -0.0476 | |||
| CACI / CACI International Inc | 0.01 | 14.32 | 2.48 | 48.50 | 1.9245 | 0.4693 | |||
| PRMB / Primo Brands Corporation | 0.08 | 7.04 | 2.40 | -10.64 | 1.8629 | -0.4790 | |||
| CG / The Carlyle Group Inc. | 0.05 | -25.78 | 2.34 | -12.47 | 1.8133 | -0.5137 | |||
| DOCS / Doximity, Inc. | 0.04 | 7.04 | 2.30 | 13.17 | 1.7810 | 0.0132 | |||
| WAL / Western Alliance Bancorporation | 0.03 | 26.25 | 2.28 | 28.11 | 1.7686 | 0.2185 | |||
| DBD / Diebold Nixdorf, Incorporated | 0.04 | 8.95 | 2.27 | 38.09 | 1.7582 | 0.3280 | |||
| SN / SharkNinja, Inc. | 0.02 | -7.34 | 2.24 | 9.99 | 1.7349 | -0.0369 | |||
| TRU / TransUnion | 0.03 | 7.04 | 2.22 | 13.51 | 1.7213 | 0.0181 | |||
| CCJ / Cameco Corporation | 0.03 | 7.04 | 2.16 | 93.04 | 1.6777 | 0.7017 | |||
| IDA / IDACORP, Inc. | 0.02 | 7.04 | 2.01 | 6.36 | 1.5571 | -0.0875 | |||
| ONB / Old National Bancorp | 0.09 | -5.77 | 1.98 | -5.12 | 1.5373 | -0.2820 | |||
| BFAM / Bright Horizons Family Solutions Inc. | 0.02 | -25.07 | 1.95 | -27.10 | 1.5090 | -0.8158 | |||
| CW / Curtiss-Wright Corporation | 0.00 | -19.88 | 1.89 | 23.42 | 1.4679 | 0.1316 | |||
| MRCY / Mercury Systems, Inc. | 0.03 | -13.33 | 1.86 | 8.31 | 1.4455 | -0.0531 | |||
| ASO / Academy Sports and Outdoors, Inc. | 0.04 | 81.74 | 1.86 | 78.52 | 1.4448 | 0.5360 | |||
| CHE / Chemed Corporation | 0.00 | -6.10 | 1.84 | -25.71 | 1.4309 | -0.7317 | |||
| BANR / Banner Corporation | 0.03 | 7.04 | 1.84 | 7.72 | 1.4283 | -0.0614 | |||
| GOGO / Gogo Inc. | 0.12 | 1.83 | 1.4187 | 1.4187 | |||||
| ELS / Equity LifeStyle Properties, Inc. | 0.03 | 7.04 | 1.82 | -0.98 | 1.4150 | -0.1907 | |||
| CIEN / Ciena Corporation | 0.02 | 7.04 | 1.82 | 44.01 | 1.4094 | 0.3107 | |||
| COHR / Coherent Corp. | 0.02 | 1.77 | 1.3724 | 1.3724 | |||||
| ACVA / ACV Auctions Inc. | 0.11 | 7.04 | 1.73 | 23.24 | 1.3452 | 0.1192 | |||
| DT / Dynatrace, Inc. | 0.03 | 7.05 | 1.73 | 25.33 | 1.3405 | 0.1394 | |||
| BWXT / BWX Technologies, Inc. | 0.01 | 1.71 | 1.3292 | 1.3292 | |||||
| CFLT / Confluent, Inc. | 0.07 | 7.04 | 1.70 | 13.86 | 1.3191 | 0.0178 | |||
| HR / Healthcare Realty Trust Incorporated | 0.11 | 7.04 | 1.70 | 0.41 | 1.3179 | -0.1555 | |||
| NVT / nVent Electric plc | 0.02 | 73.89 | 1.63 | 143.28 | 1.2646 | 0.6801 | |||
| CART / Maplebear Inc. | 0.04 | 1.62 | 1.2591 | 1.2591 | |||||
| EWBC / East West Bancorp, Inc. | 0.02 | -9.51 | 1.62 | 1.83 | 1.2547 | -0.1295 | |||
| CWST / Casella Waste Systems, Inc. | 0.01 | 14.90 | 1.60 | 18.92 | 1.2440 | 0.0688 | |||
| JBTM / JBT Marel Corporation | 0.01 | 7.04 | 1.59 | 5.37 | 1.2336 | -0.0816 | |||
| WGS / GeneDx Holdings Corp. | 0.02 | 39.56 | 1.58 | 45.54 | 1.2273 | 0.2797 | |||
| LRN / Stride, Inc. | 0.01 | -24.98 | 1.58 | -13.89 | 1.2220 | -0.3719 | |||
| MMSI / Merit Medical Systems, Inc. | 0.02 | 67.71 | 1.55 | 48.33 | 1.2026 | 0.2919 | |||
| POOL / Pool Corporation | 0.01 | 35.91 | 1.53 | 24.47 | 1.1878 | 0.1158 | |||
| ULS / UL Solutions Inc. | 0.02 | 1.48 | 1.1487 | 1.1487 | |||||
| WAY / Waystar Holding Corp. | 0.04 | 7.04 | 1.47 | 17.11 | 1.1367 | 0.0465 | |||
| PSTG / Pure Storage, Inc. | 0.03 | 14.08 | 1.46 | 2.31 | 1.1345 | 0.4094 | |||
| MZTI / The Marzetti Company | 0.01 | 58.76 | 1.46 | 56.73 | 1.1299 | 0.3203 | |||
| WSC / WillScot Holdings Corporation | 0.05 | 7.04 | 1.44 | 5.57 | 1.1172 | -0.0721 | |||
| CRS / Carpenter Technology Corporation | 0.01 | 1.44 | 1.1171 | 1.1171 | |||||
| REXR / Rexford Industrial Realty, Inc. | 0.04 | 7.05 | 1.43 | -2.72 | 1.1094 | -0.1717 | |||
| VRRM / Verra Mobility Corporation | 0.06 | 11.68 | 1.41 | 25.90 | 1.0907 | 0.1183 | |||
| AGYS / Agilysys, Inc. | 0.01 | -0.67 | 1.40 | -13.57 | 1.0874 | 0.1707 | |||
| EXAS / Exact Sciences Corporation | 0.03 | -20.68 | 1.36 | -2.58 | 1.0559 | -0.1620 | |||
| JLL / Jones Lang LaSalle Incorporated | 0.01 | 7.04 | 1.35 | 10.43 | 1.0441 | -0.0177 | |||
| ADC / Agree Realty Corporation | 0.02 | -40.61 | 1.28 | -43.79 | 0.9912 | -0.9890 | |||
| EHC / Encompass Health Corporation | 0.01 | -14.25 | 1.27 | 3.83 | 0.9884 | -0.0808 | |||
| GTX / Garrett Motion Inc. | 0.12 | 7.04 | 1.27 | 34.50 | 0.9864 | 0.1622 | |||
| CADE / Cadence Bank | 0.04 | 7.04 | 1.26 | 12.83 | 0.9760 | 0.0039 | |||
| EXLS / ExlService Holdings, Inc. | 0.03 | -25.42 | 1.26 | -30.86 | 0.9758 | -0.6084 | |||
| WCPRF / Whitecap Resources Inc. | 0.19 | 7.04 | 1.25 | 11.60 | 0.9706 | -0.0068 | |||
| BCO / The Brink's Company | 0.01 | 39.38 | 1.23 | 44.47 | 0.9531 | 0.2121 | |||
| AIT / Applied Industrial Technologies, Inc. | 0.01 | 1.23 | 0.9516 | 0.9516 | |||||
| EXP / Eagle Materials Inc. | 0.01 | 38.24 | 1.22 | 25.98 | 0.9483 | 0.1023 | |||
| GTLB / GitLab Inc. | 0.03 | 31.78 | 1.21 | 26.44 | 0.9354 | 0.1048 | |||
| CWAN / Clearwater Analytics Holdings, Inc. | 0.05 | 7.04 | 1.20 | -12.40 | 0.9320 | -0.2630 | |||
| GXO / GXO Logistics, Inc. | 0.02 | 62.84 | 1.19 | 103.07 | 0.9235 | 0.4124 | |||
| RVLV / Revolve Group, Inc. | 0.06 | 162.74 | 1.19 | 145.15 | 0.9227 | 0.5000 | |||
| OC / Owens Corning | 0.01 | 7.04 | 1.13 | 3.01 | 0.8764 | -0.0786 | |||
| SIG / Signet Jewelers Limited | 0.01 | 7.05 | 1.11 | 46.64 | 0.8636 | 0.2023 | |||
| MLI / Mueller Industries, Inc. | 0.01 | 7.04 | 1.09 | 11.70 | 0.8444 | -0.0044 | |||
| SMPL / The Simply Good Foods Company | 0.03 | 1.08 | 0.8370 | 0.8370 | |||||
| COLD / Americold Realty Trust, Inc. | 0.06 | -35.80 | 1.08 | -50.23 | 0.8340 | -1.0487 | |||
| FLS / Flowserve Corporation | 0.02 | 1.03 | 0.8016 | 0.8016 | |||||
| EPAM / EPAM Systems, Inc. | 0.01 | 7.06 | 1.01 | 12.17 | 0.7867 | -0.0013 | |||
| ADT / ADT Inc. | 0.12 | 7.04 | 1.00 | 11.40 | 0.7739 | -0.0064 | |||
| SKY / Champion Homes, Inc. | 0.02 | 7.05 | 0.98 | -29.25 | 0.7619 | -0.4479 | |||
| AR / Antero Resources Corporation | 0.02 | 7.05 | 0.95 | 6.61 | 0.7383 | -0.0394 | |||
| EMBC / Embecta Corp. | 0.09 | 7.04 | 0.89 | -18.64 | 0.6875 | -0.2616 | |||
| TGLS / Tecnoglass Inc. | 0.01 | -5.68 | 0.87 | 1.87 | 0.6764 | -0.0685 | |||
| LPX / Louisiana-Pacific Corporation | 0.01 | 7.05 | 0.87 | 0.12 | 0.6726 | -0.0822 | |||
| CBZ / CBIZ, Inc. | 0.01 | 0.82 | 0.6369 | 0.6369 | |||||
| VCEL / Vericel Corporation | 0.02 | 7.05 | 0.77 | 2.11 | 0.6007 | -0.0602 | |||
| PCTY / Paylocity Holding Corporation | 0.00 | -36.13 | 0.77 | -38.28 | 0.5950 | -0.4868 | |||
| WFRD / Weatherford International plc | 0.01 | 7.04 | 0.71 | 0.57 | 0.5517 | -0.0644 | |||
| DSGX / The Descartes Systems Group Inc. | 0.01 | -30.89 | 0.71 | -30.40 | 0.5476 | -0.3351 | |||
| PODD / Insulet Corporation | 0.00 | -38.27 | 0.70 | -26.13 | 0.5440 | -0.2833 | |||
| PWP / Perella Weinberg Partners | 0.04 | 0.70 | 0.5414 | 0.5414 | |||||
| EYE / National Vision Holdings, Inc. | 0.03 | -65.49 | 0.66 | -39.30 | 0.5105 | -0.0397 | |||
| FRPT / Freshpet, Inc. | 0.01 | 7.03 | 0.64 | -12.48 | 0.4950 | -0.1406 | |||
| MRX / Marex Group plc | 0.02 | -58.58 | 0.63 | -53.74 | 0.4851 | -0.6920 | |||
| NEOG / Neogen Corporation | 0.02 | -72.31 | 0.12 | -84.77 | 0.0910 | -0.5786 | |||
| CGNX / Cognex Corporation | 0.00 | -100.00 | 0.00 | -100.00 | -0.7276 |