Basic Stats
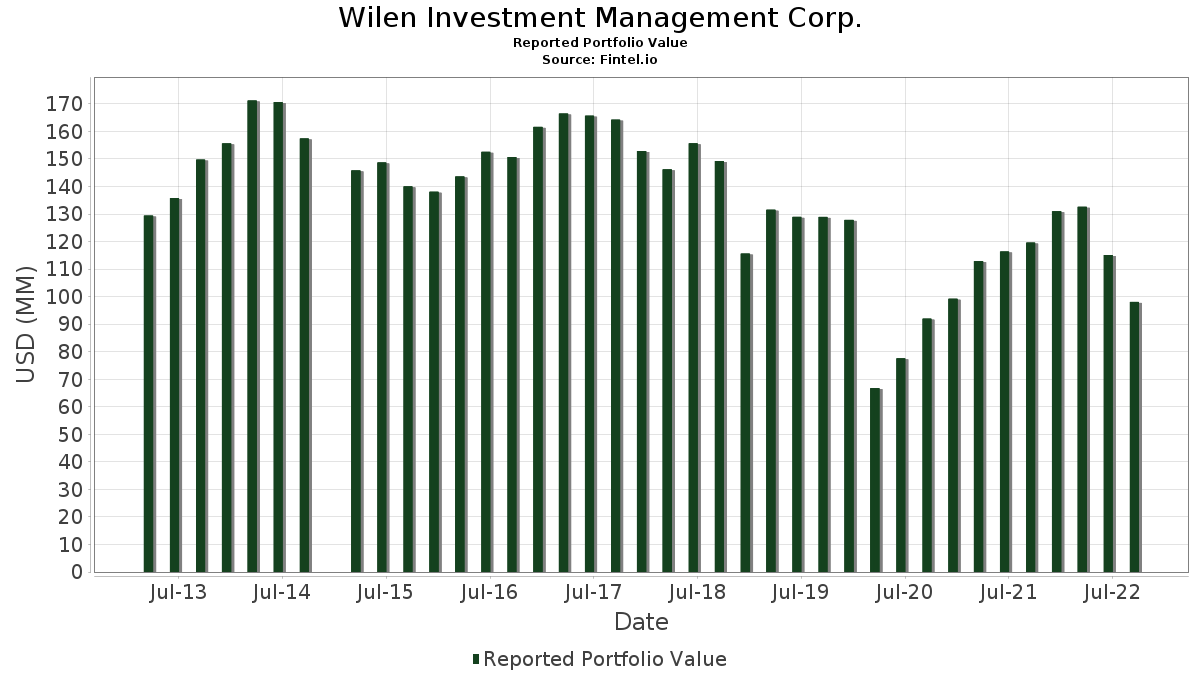
| Portfolio Value | $ 98,076,000 |
| Current Positions | 87 |
Latest Holdings, Performance, AUM (from 13F, 13D)
Wilen Investment Management Corp. has disclosed 87 total holdings in their latest SEC filings. Most recent portfolio value is calculated to be $ 98,076,000 USD. Actual Assets Under Management (AUM) is this value plus cash (which is not disclosed). Wilen Investment Management Corp.’s top holdings are VAALCO Energy, Inc. (US:EGY) , U-Haul Holding Company (US:UHAL) , Huntsman Corporation (US:HUN) , Olin Corporation (US:OLN) , and Delta Apparel, Inc. (US:DLA) . Wilen Investment Management Corp.’s new positions include SPX Technologies, Inc. (US:SPXC) , . Wilen Investment Management Corp.’s top industries are "Miscellaneous Manufacturing Industries" (sic 39) , "Paper And Allied Products" (sic 26) , and "Lumber And Wood Products, Except Furniture" (sic 24) .
Top Increases This Quarter
We use the change in the portfolio allocation because this is the most meaningful metric. Changes can be due to trades or changes in share prices.
| Security | Shares (MM) |
Value (MM$) |
Portfolio % | ΔPortfolio % |
|---|---|---|---|---|
| 0.02 | 10.03 | 10.2288 | 2.0462 | |
| 0.02 | 5.18 | 5.2847 | 1.2351 | |
| 0.04 | 3.99 | 4.0642 | 1.0257 | |
| 0.05 | 3.98 | 4.0632 | 0.8744 | |
| 0.02 | 2.44 | 2.4919 | 0.7269 | |
| 0.14 | 5.77 | 5.8791 | 0.4605 | |
| 0.01 | 1.34 | 1.3632 | 0.3183 | |
| 0.07 | 5.15 | 5.2520 | 0.3147 | |
| 0.01 | 1.49 | 1.5233 | 0.2412 | |
| 0.02 | 1.71 | 1.7466 | 0.2308 |
Top Decreases This Quarter
We use the change in the portfolio allocation because this is the most meaningful metric. Changes can be due to trades or changes in share prices.
| Security | Shares (MM) |
Value (MM$) |
Portfolio % | ΔPortfolio % |
|---|---|---|---|---|
| 3.13 | 13.31 | 13.5701 | -4.2692 | |
| 0.41 | 5.58 | 5.6854 | -3.7333 | |
| 0.13 | 2.27 | 2.3105 | -1.8304 | |
| 0.03 | 2.00 | 2.0423 | -0.1545 | |
| 0.08 | 0.51 | 0.5200 | -0.1358 | |
| 0.17 | 2.47 | 2.5205 | -0.0880 | |
| 0.00 | 0.00 | -0.0860 | ||
| 0.01 | 0.18 | 0.1815 | -0.0209 | |
| 0.00 | 0.10 | 0.1050 | -0.0140 | |
| 0.00 | 0.17 | 0.1733 | -0.0134 |
13D/G Filings
This is a list of 13D and 13G filings made in the last year (if any). Click the link icon to see the full transaction history. Green rows indicate new positions. Red rows indicate closed positions.
| File Date | Form | Security | Prev Shares |
Current Shares |
ΔShares % | % Ownership |
% ΔOwnership | |
|---|---|---|---|---|---|---|---|---|
| 2024-09-30 | DLAPQ / Delta Apparel, Inc. | 499,319 | 0 | -100.00 | 0.00 | -100.00 |
13F and Fund Filings
This form was filed on 2022-11-14 for the reporting period 2022-09-30. Click the link icon to see the full transaction history.
Upgrade to unlock premium data and export to Excel ![]() .
.
| Security | Type | Avg Share Price | Shares (MM) |
ΔShares (%) |
ΔShares (%) |
Value ($MM) |
Portfolio (%) |
ΔPortfolio (%) |
|
|---|---|---|---|---|---|---|---|---|---|
| EGY / VAALCO Energy, Inc. | 3.13 | 2.93 | 13.31 | -35.20 | 13.5701 | -4.2692 | |||
| UHAL / U-Haul Holding Company | 0.02 | -0.25 | 10.03 | 6.50 | 10.2288 | 2.0462 | |||
| HUN / Huntsman Corporation | 0.26 | 0.50 | 6.40 | -12.96 | 6.5215 | 0.1387 | |||
| OLN / Olin Corporation | 0.14 | 0.00 | 5.77 | -7.57 | 5.8791 | 0.4605 | |||
| DLA / Delta Apparel, Inc. | 0.41 | 3.79 | 5.58 | -48.58 | 5.6854 | -3.7333 | |||
| URI / United Rentals, Inc. | 0.02 | 0.00 | 5.18 | 11.18 | 5.2847 | 1.2351 | |||
| IMKTA / Ingles Markets, Incorporated | 0.07 | -1.36 | 5.15 | -9.38 | 5.2520 | 0.3147 | |||
| COP / ConocoPhillips | 0.04 | 0.00 | 3.99 | 13.95 | 4.0642 | 1.0257 | |||
| CCF / Chase Corp. | 0.05 | -0.61 | 3.98 | 8.55 | 4.0632 | 0.8744 | |||
| QEPC / Q.E.P. Co., Inc. | 0.17 | -0.67 | 2.47 | -17.68 | 2.5205 | -0.0880 | |||
| MPC / Marathon Petroleum Corporation | 0.02 | -0.40 | 2.44 | 20.28 | 2.4919 | 0.7269 | |||
| TSE / Trinseo PLC | 0.13 | 0.36 | 2.27 | -52.46 | 2.3105 | -1.8304 | |||
| SXI / Standex International Corporation | 0.03 | -4.48 | 2.26 | -7.90 | 2.3054 | 0.1728 | |||
| LCII / LCI Industries | 0.02 | -0.96 | 2.09 | -9.87 | 2.1330 | 0.1169 | |||
| EMN / Eastman Chemical Company | 0.03 | 0.00 | 2.00 | -20.80 | 2.0423 | -0.1545 | |||
| WLK / Westlake Corporation | 0.02 | 0.00 | 1.91 | -11.79 | 1.9454 | 0.0666 | |||
| LHX / L3Harris Technologies, Inc. | 0.01 | -1.12 | 1.82 | -15.08 | 1.8608 | -0.0059 | |||
| PSX / Phillips 66 | 0.02 | 0.00 | 1.71 | -1.83 | 1.7466 | 0.2308 | |||
| WTS / Watts Water Technologies, Inc. | 0.01 | -1.24 | 1.49 | 1.22 | 1.5233 | 0.2412 | |||
| KOP / Koppers Holdings Inc. | 0.07 | -0.30 | 1.36 | -7.11 | 1.3857 | 0.1148 | |||
| TT / Trane Technologies plc | 0.01 | 0.00 | 1.34 | 11.14 | 1.3632 | 0.3183 | |||
| US2243991054 / Crane Co. | 0.01 | 0.00 | 1.28 | 0.00 | 1.3010 | 0.1926 | |||
| BERY / Berry Global Group, Inc. | 0.02 | 1.39 | 1.01 | -13.62 | 1.0278 | 0.0141 | |||
| WCC / WESCO International, Inc. | 0.01 | 0.00 | 0.94 | 11.77 | 0.9584 | 0.2279 | |||
| BMY / Bristol-Myers Squibb Company | 0.01 | 0.00 | 0.89 | -7.86 | 0.9085 | 0.0685 | |||
| CARR / Carrier Global Corporation | 0.02 | 0.00 | 0.82 | -0.73 | 0.8320 | 0.1180 | |||
| NTIC / Northern Technologies International Corporation | 0.05 | -7.81 | 0.58 | 28.00 | 0.5873 | 0.1964 | |||
| BLDR / Builders FirstSource, Inc. | 0.01 | 0.00 | 0.55 | 10.36 | 0.5649 | 0.1288 | |||
| HRI / Herc Holdings Inc. | 0.01 | 8.52 | 0.52 | 23.58 | 0.5343 | 0.1660 | |||
| HES / Hess Corporation | 0.00 | 0.00 | 0.52 | 2.39 | 0.5251 | 0.0882 | |||
| HBI / Hanesbrands Inc. | 0.08 | 0.00 | 0.51 | -32.45 | 0.5200 | -0.1358 | |||
| CMT / Core Molding Technologies, Inc. | 0.05 | -14.72 | 0.48 | -7.36 | 0.4874 | 0.0392 | |||
| SCL / Stepan Company | 0.00 | -4.15 | 0.43 | -11.70 | 0.4384 | 0.0154 | |||
| DENN / Denny's Corporation | 0.04 | 0.00 | 0.36 | 9.09 | 0.3671 | 0.0804 | |||
| IR / Ingersoll Rand Inc. | 0.01 | -1.07 | 0.35 | 2.63 | 0.3579 | 0.0608 | |||
| DCO / Ducommun Incorporated | 0.01 | 0.00 | 0.34 | -8.11 | 0.3467 | 0.0253 | |||
| LSI / Life Storage Inc - Registered Shares | 0.00 | -1.62 | 0.33 | -2.65 | 0.3365 | 0.0420 | |||
| ALLE / Allegion plc | 0.00 | -0.91 | 0.32 | -9.09 | 0.3263 | 0.0205 | |||
| ETN / Eaton Corporation plc | 0.00 | -4.00 | 0.32 | 1.59 | 0.3253 | 0.0525 | |||
| UFPI / UFP Industries, Inc. | 0.00 | 0.00 | 0.30 | 5.96 | 0.3079 | 0.0604 | |||
| GT / The Goodyear Tire & Rubber Company | 0.03 | 0.00 | 0.29 | -4.55 | 0.2998 | 0.0322 | |||
| SXT / Sensient Technologies Corporation | 0.00 | 0.00 | 0.25 | -13.68 | 0.2508 | 0.0033 | |||
| TTE / TotalEnergies SE - Depositary Receipt (Common Stock) | 0.01 | 0.00 | 0.24 | -11.96 | 0.2478 | 0.0080 | |||
| BECN / Beacon Roofing Supply, Inc. | 0.00 | 0.00 | 0.22 | 5.88 | 0.2202 | 0.0430 | |||
| HRB / H&R Block, Inc. | 0.01 | 0.00 | 0.21 | 20.00 | 0.2141 | 0.0621 | |||
| NGLS / Targa Resources Partners LP | 0.00 | 0.00 | 0.18 | 0.00 | 0.1866 | 0.0276 | |||
| AMOT / Allied Motion Technologies Inc | 0.01 | 0.00 | 0.18 | 29.50 | 0.1835 | 0.0628 | |||
| CC / The Chemours Company | 0.01 | 0.00 | 0.18 | -23.61 | 0.1815 | -0.0209 | |||
| UUU / Universal Safety Products, Inc | 0.05 | 0.00 | 0.17 | 7.41 | 0.1774 | 0.0367 | |||
| JOUT / Johnson Outdoors Inc. | 0.00 | -5.67 | 0.17 | -20.93 | 0.1733 | -0.0134 | |||
| OSK / Oshkosh Corporation | 0.00 | 0.00 | 0.16 | -13.90 | 0.1642 | 0.0017 | |||
| RTX / RTX Corporation | 0.00 | 0.00 | 0.15 | -13.07 | 0.1560 | 0.0031 | |||
| TRS / TriMas Corporation | 0.01 | 0.00 | 0.13 | -8.90 | 0.1356 | 0.0088 | |||
| AIV / Apartment Investment and Management Company | 0.02 | 0.00 | 0.12 | 16.19 | 0.1244 | 0.0332 | |||
| WMB / The Williams Companies, Inc. | 0.00 | 0.00 | 0.11 | -8.20 | 0.1142 | 0.0082 | |||
| CIR / Circor International Inc | 0.01 | -1.40 | 0.11 | 1.82 | 0.1142 | 0.0186 | |||
| GFF / Griffon Corporation | 0.00 | 0.00 | 0.11 | 5.77 | 0.1122 | 0.0218 | |||
| VSEC / VSE Corporation | 0.00 | 0.00 | 0.11 | -5.31 | 0.1091 | 0.0109 | |||
| L / Loews Corporation | 0.00 | 0.00 | 0.10 | -14.63 | 0.1071 | 0.0002 | |||
| SPXC / SPX Technologies, Inc. | 0.00 | 0.10 | 0.1060 | 0.1060 | |||||
| DORM / Dorman Products, Inc. | 0.00 | 0.00 | 0.10 | -24.82 | 0.1050 | -0.0140 | |||
| ATRO / Astronics Corporation | 0.01 | 0.00 | 0.10 | -20.16 | 0.1009 | -0.0068 | |||
| CSL / Carlisle Companies Incorporated | 0.00 | 0.00 | 0.10 | 18.07 | 0.0999 | 0.0278 | |||
| VIRC / Virco Mfg. Corporation | 0.02 | -2.05 | 0.10 | 11.76 | 0.0969 | 0.0230 | |||
| SHYF / The Shyft Group, Inc. | 0.00 | 0.00 | 0.09 | 11.11 | 0.0918 | 0.0214 | |||
| ATRI / Atrion Corporation | 0.00 | 0.00 | 0.09 | -11.34 | 0.0877 | 0.0034 | |||
| ESCA / Escalade, Incorporated | 0.01 | 41.28 | 0.09 | 8.86 | 0.0877 | 0.0191 | |||
| RICK / RCI Hospitality Holdings, Inc. | 0.00 | 0.00 | 0.08 | 33.33 | 0.0775 | 0.0280 | |||
| RDI / Reading International, Inc. | 0.02 | 0.00 | 0.07 | -7.79 | 0.0724 | 0.0055 | |||
| DOW / Dow Inc. | 0.00 | 45.45 | 0.07 | 25.00 | 0.0714 | 0.0227 | |||
| OTIS / Otis Worldwide Corporation | 0.00 | 0.00 | 0.06 | -9.09 | 0.0612 | 0.0038 | |||
| BRK.B / Berkshire Hathaway Inc. | 0.00 | 0.00 | 0.05 | -1.85 | 0.0540 | 0.0071 | |||
| GOOD / Gladstone Commercial Corporation | 0.00 | 40.00 | 0.05 | 15.56 | 0.0530 | 0.0139 | |||
| PATK / Patrick Industries, Inc. | 0.00 | 0.00 | 0.05 | -15.52 | 0.0500 | -0.0004 | |||
| USAC / USA Compression Partners, LP - Limited Partnership | 0.00 | 0.00 | 0.04 | 2.44 | 0.0428 | 0.0072 | |||
| ABLT / American Biltrite Inc. | 0.00 | 0.00 | 0.04 | 0.00 | 0.0408 | 0.0060 | |||
| PFIN / P&F Industries, Inc. | 0.01 | 0.00 | 0.03 | 0.00 | 0.0285 | 0.0042 | |||
| VLO / Valero Energy Corporation | 0.00 | 0.00 | 0.03 | 0.00 | 0.0265 | 0.0039 | |||
| BGSF / BGSF, Inc. | 0.00 | 0.00 | 0.02 | -7.69 | 0.0245 | 0.0019 | |||
| SBGI / Sinclair, Inc. | 0.00 | 0.00 | 0.02 | -8.33 | 0.0224 | 0.0016 | |||
| KR / The Kroger Co. | 0.00 | 0.00 | 0.02 | -10.53 | 0.0173 | 0.0008 | |||
| CODI / Compass Diversified | 0.00 | 0.00 | 0.02 | -19.05 | 0.0173 | -0.0009 | |||
| EML / The Eastern Company | 0.00 | 0.00 | 0.01 | -16.67 | 0.0153 | -0.0003 | |||
| XOM / Exxon Mobil Corporation | 0.00 | 0.00 | 0.01 | 8.33 | 0.0133 | 0.0028 | |||
| PFE / Pfizer Inc. | 0.00 | 0.00 | 0.01 | -18.75 | 0.0133 | -0.0006 | |||
| RITM.PRC / Rithm Capital Corp. - Preferred Stock | 0.00 | 0.00 | 0.01 | -25.00 | 0.0122 | -0.0017 | |||
| MNRO / Monro, Inc. | 0.00 | 0.00 | 0.01 | 0.00 | 0.0082 | 0.0012 | |||
| JELD / JELD-WEN Holding, Inc. | 0.00 | -100.00 | 0.00 | -100.00 | -0.0122 | ||||
| US7846351044 / SPX Corp | 0.00 | -100.00 | 0.00 | -100.00 | -0.0860 |