Basic Stats
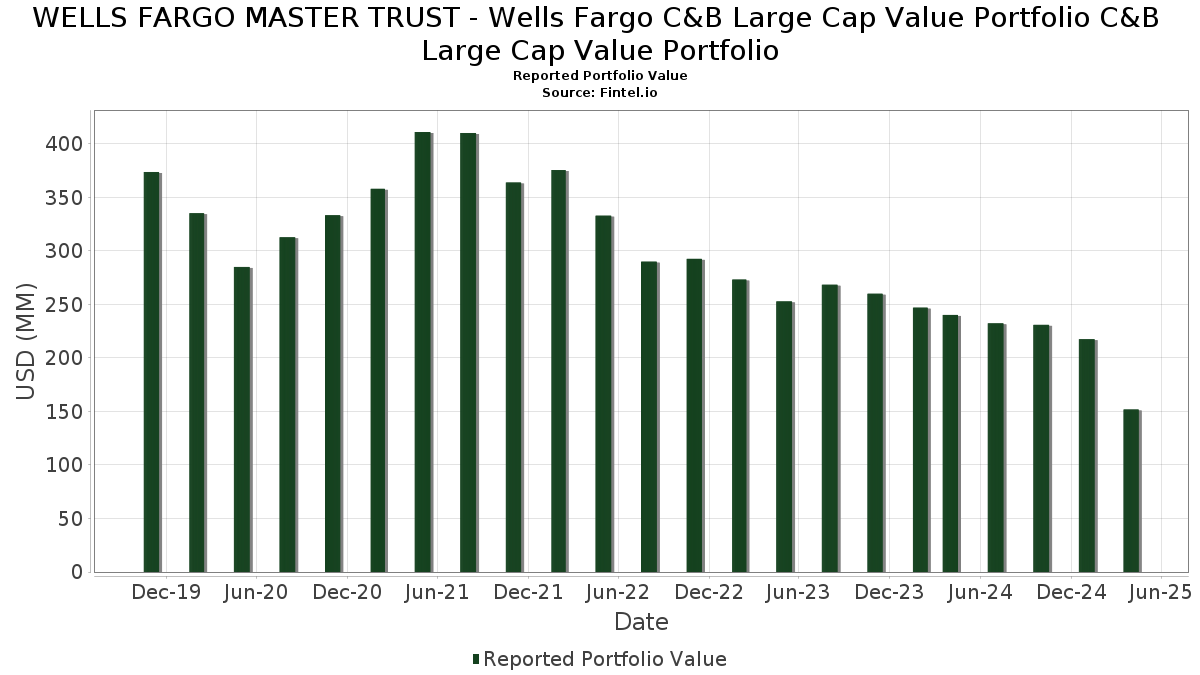
| Portfolio Value | $ 151,858,535 |
| Current Positions | 49 |
Latest Holdings, Performance, AUM (from 13F, 13D)
WELLS FARGO MASTER TRUST - Wells Fargo C&B Large Cap Value Portfolio C&B Large Cap Value Portfolio has disclosed 49 total holdings in their latest SEC filings. Most recent portfolio value is calculated to be $ 151,858,535 USD. Actual Assets Under Management (AUM) is this value plus cash (which is not disclosed). WELLS FARGO MASTER TRUST - Wells Fargo C&B Large Cap Value Portfolio C&B Large Cap Value Portfolio’s top holdings are Canadian Pacific Kansas City Limited (US:CP) , Alphabet Inc. (US:GOOG) , Intercontinental Exchange, Inc. (US:ICE) , Citigroup Inc. (US:C) , and Berkshire Hathaway Inc. (US:BRK.B) . WELLS FARGO MASTER TRUST - Wells Fargo C&B Large Cap Value Portfolio C&B Large Cap Value Portfolio’s new positions include Danaher Corporation (US:DHR) , .
Top Increases This Quarter
We use the change in the portfolio allocation because this is the most meaningful metric. Changes can be due to trades or changes in share prices.
| Security | Shares (MM) |
Value (MM$) |
Portfolio % | ΔPortfolio % |
|---|---|---|---|---|
| 0.01 | 2.07 | 1.4149 | 1.4149 | |
| 0.01 | 1.98 | 1.3511 | 1.3511 | |
| 0.07 | 5.06 | 3.4541 | 1.2335 | |
| 1.32 | 1.32 | 0.8995 | 0.8995 | |
| 1.32 | 1.32 | 0.8995 | 0.8995 | |
| 1.32 | 1.32 | 0.8995 | 0.8995 | |
| 1.32 | 1.32 | 0.8995 | 0.8995 | |
| 1.32 | 1.32 | 0.8995 | 0.8995 | |
| 0.03 | 4.03 | 2.7505 | 0.8150 | |
| 0.01 | 4.40 | 3.0004 | 0.6857 |
Top Decreases This Quarter
We use the change in the portfolio allocation because this is the most meaningful metric. Changes can be due to trades or changes in share prices.
| Security | Shares (MM) |
Value (MM$) |
Portfolio % | ΔPortfolio % |
|---|---|---|---|---|
| 0.01 | 1.76 | 1.1978 | -1.5333 | |
| 0.01 | 1.66 | 1.1349 | -0.9263 | |
| 0.02 | 2.47 | 1.6826 | -0.6757 | |
| 0.04 | 5.79 | 3.9516 | -0.5076 | |
| 0.01 | 3.58 | 2.4458 | -0.3048 | |
| 0.01 | 3.58 | 2.4428 | -0.2556 | |
| 0.01 | 2.16 | 1.4711 | -0.2393 | |
| 0.02 | 2.11 | 1.4422 | -0.2215 | |
| 0.03 | 2.62 | 1.7903 | -0.2148 | |
| 0.01 | 5.16 | 3.5183 | -0.1996 |
13F and Fund Filings
This form was filed on 2025-06-25 for the reporting period 2025-04-30. Click the link icon to see the full transaction history.
Upgrade to unlock premium data and export to Excel ![]() .
.
| Security | Type | Avg Share Price | Shares (MM) |
ΔShares (%) |
ΔShares (%) |
Value ($MM) |
Portfolio (%) |
ΔPortfolio (%) |
|
|---|---|---|---|---|---|---|---|---|---|
| CP / Canadian Pacific Kansas City Limited | 0.09 | -22.87 | 6.34 | -29.78 | 4.3283 | 0.1758 | |||
| GOOG / Alphabet Inc. | 0.04 | -23.71 | 5.79 | -40.30 | 3.9516 | -0.5076 | |||
| ICE / Intercontinental Exchange, Inc. | 0.03 | -27.68 | 5.78 | -23.99 | 3.9457 | 0.4484 | |||
| C / Citigroup Inc. | 0.08 | -23.69 | 5.49 | -35.92 | 3.7430 | -0.1920 | |||
| BRK.B / Berkshire Hathaway Inc. | 0.01 | -43.97 | 5.16 | -36.26 | 3.5183 | -0.1996 | |||
| BAC / Bank of America Corporation | 0.13 | -20.37 | 5.07 | -31.42 | 3.4605 | 0.0615 | |||
| MDLZ / Mondelez International, Inc. | 0.07 | -10.81 | 5.06 | 4.78 | 3.4541 | 1.2335 | |||
| LH / Labcorp Holdings Inc. | 0.02 | -29.11 | 4.73 | -31.62 | 3.2268 | 0.0484 | |||
| AER / AerCap Holdings N.V. | 0.04 | -35.67 | 4.63 | -28.67 | 3.1567 | 0.1753 | |||
| CI / The Cigna Group | 0.01 | -24.45 | 4.40 | -12.67 | 3.0004 | 0.6857 | |||
| NEE / NextEra Energy, Inc. | 0.06 | -27.65 | 4.31 | -32.39 | 2.9418 | 0.0108 | |||
| UL / Unilever PLC - Depositary Receipt (Common Stock) | 0.06 | -37.69 | 4.05 | -30.99 | 2.7654 | 0.0657 | |||
| DHI / D.R. Horton, Inc. | 0.03 | 7.53 | 4.03 | -4.28 | 2.7505 | 0.8150 | |||
| RTX / RTX Corporation | 0.03 | -24.36 | 3.94 | -26.02 | 2.6915 | 0.2408 | |||
| MDT / Medtronic plc | 0.05 | -27.45 | 3.93 | -32.29 | 2.6840 | 0.0135 | |||
| XOM / Exxon Mobil Corporation | 0.04 | -28.76 | 3.74 | -29.56 | 2.5516 | 0.1114 | |||
| MSFT / Microsoft Corporation | 0.01 | -37.10 | 3.58 | -40.10 | 2.4458 | -0.3048 | |||
| ACN / Accenture plc | 0.01 | -21.52 | 3.58 | -39.03 | 2.4428 | -0.2556 | |||
| FI / Fiserv, Inc. | 0.02 | -25.39 | 3.47 | -36.25 | 2.3665 | -0.1346 | |||
| GM / General Motors Company | 0.07 | -28.61 | 3.38 | -34.71 | 2.3094 | -0.0733 | |||
| PSA / Public Storage | 0.01 | -23.45 | 3.21 | -22.94 | 2.1913 | 0.2753 | |||
| HON / Honeywell International Inc. | 0.01 | -28.10 | 3.15 | -32.35 | 2.1506 | 0.0091 | |||
| WMT / Walmart Inc. | 0.03 | -8.01 | 3.04 | -8.89 | 2.0771 | 0.5417 | |||
| AIG / American International Group, Inc. | 0.04 | -39.64 | 3.03 | -33.20 | 2.0705 | -0.0175 | |||
| CDNS / Cadence Design Systems, Inc. | 0.01 | -23.07 | 2.85 | -23.04 | 1.9449 | 0.2426 | |||
| COP / ConocoPhillips | 0.03 | -32.46 | 2.76 | -39.09 | 1.8808 | -0.1996 | |||
| AL / Air Lease Corporation | 0.06 | -20.30 | 2.64 | -19.33 | 1.8021 | 0.2970 | |||
| CF / CF Industries Holdings, Inc. | 0.03 | -29.23 | 2.62 | -39.85 | 1.7903 | -0.2148 | |||
| VRTX / Vertex Pharmaceuticals Incorporated | 0.01 | -30.51 | 2.61 | -23.33 | 1.7807 | 0.2164 | |||
| NKE / NIKE, Inc. | 0.04 | 15.64 | 2.50 | -15.20 | 1.7056 | 0.3508 | |||
| NXPI / NXP Semiconductors N.V. | 0.01 | -28.79 | 2.47 | -37.08 | 1.6839 | -0.1187 | |||
| CBRE / CBRE Group, Inc. | 0.02 | -43.06 | 2.47 | -51.95 | 1.6826 | -0.6757 | |||
| JNJ / Johnson & Johnson | 0.01 | -52.18 | 2.16 | -51.68 | 1.4711 | -0.2393 | |||
| EOG / EOG Resources, Inc. | 0.02 | -33.42 | 2.11 | -41.61 | 1.4422 | -0.2215 | |||
| LHX / L3Harris Technologies, Inc. | 0.01 | -38.99 | 2.11 | -36.70 | 1.4396 | -0.0921 | |||
| ETN / Eaton Corporation plc | 0.01 | 2.07 | 1.4149 | 1.4149 | |||||
| CAT / Caterpillar Inc. | 0.01 | 4.15 | 2.02 | -13.31 | 1.3783 | 0.3075 | |||
| VMC / Vulcan Materials Company | 0.01 | -11.92 | 2.00 | -15.73 | 1.3638 | 0.2737 | |||
| DHR / Danaher Corporation | 0.01 | 1.98 | 1.3511 | 1.3511 | |||||
| JPM / JPMorgan Chase & Co. | 0.01 | -67.71 | 1.76 | -70.46 | 1.1978 | -1.5333 | |||
| ICLR / ICON Public Limited Company | 0.01 | -19.46 | 1.70 | -38.75 | 1.1611 | -0.1155 | |||
| IBM / International Business Machines Corporation | 0.01 | -60.78 | 1.66 | -62.90 | 1.1349 | -0.9263 | |||
| ALLSPRING GOVERNMENT MONEY MAR / STIV (000000000) | 1.32 | 1.32 | 0.8995 | 0.8995 | |||||
| ALLSPRING GOVERNMENT MONEY MAR / STIV (000000000) | 1.32 | 1.32 | 0.8995 | 0.8995 | |||||
| ALLSPRING GOVERNMENT MONEY MAR / STIV (000000000) | 1.32 | 1.32 | 0.8995 | 0.8995 | |||||
| ALLSPRING GOVERNMENT MONEY MAR / STIV (000000000) | 1.32 | 1.32 | 0.8995 | 0.8995 | |||||
| ALLSPRING GOVERNMENT MONEY MAR / STIV (000000000) | 1.32 | 1.32 | 0.8995 | 0.8995 | |||||
| SHW / The Sherwin-Williams Company | 0.00 | 51.10 | 1.28 | 49.01 | 0.8737 | 0.4784 | |||
| MMM / 3M Company | 0.00 | -39.53 | 0.59 | -44.80 | 0.4020 | -0.0887 |