Basic Stats
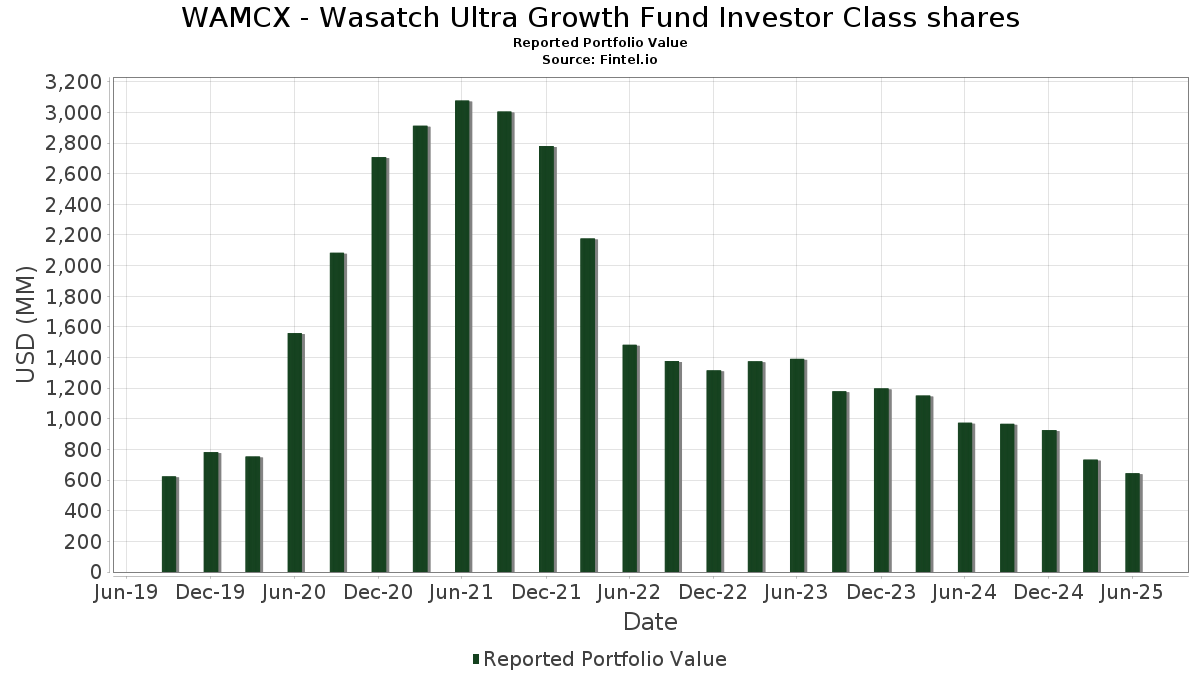
| Portfolio Value | $ 644,733,834 |
| Current Positions | 55 |
Latest Holdings, Performance, AUM (from 13F, 13D)
WAMCX - Wasatch Ultra Growth Fund Investor Class shares has disclosed 55 total holdings in their latest SEC filings. Most recent portfolio value is calculated to be $ 644,733,834 USD. Actual Assets Under Management (AUM) is this value plus cash (which is not disclosed). WAMCX - Wasatch Ultra Growth Fund Investor Class shares’s top holdings are HealthEquity, Inc. (US:HQY) , Casella Waste Systems, Inc. (US:CWST) , Shift4 Payments, Inc. (US:FOUR) , PDF Solutions, Inc. (US:PDFS) , and Freshpet, Inc. (US:FRPT) . WAMCX - Wasatch Ultra Growth Fund Investor Class shares’s new positions include Global-E Online Ltd. (MX:GLBE N) , .
Top Increases This Quarter
We use the change in the portfolio allocation because this is the most meaningful metric. Changes can be due to trades or changes in share prices.
| Security | Shares (MM) |
Value (MM$) |
Portfolio % | ΔPortfolio % |
|---|---|---|---|---|
| 0.51 | 11.46 | 1.7347 | 1.7347 | |
| 0.25 | 8.45 | 1.2796 | 1.2796 | |
| 0.07 | 19.47 | 2.9473 | 0.8715 | |
| 0.05 | 11.68 | 1.7685 | 0.7077 | |
| 0.23 | 15.44 | 2.3364 | 0.6961 | |
| 1.06 | 22.58 | 3.4180 | 0.6712 | |
| 0.24 | 23.42 | 3.5444 | 0.6378 | |
| 0.48 | 20.91 | 3.1648 | 0.6193 | |
| 0.10 | 8.52 | 1.2896 | 0.6011 | |
| 0.17 | 16.17 | 2.4481 | 0.5664 |
Top Decreases This Quarter
We use the change in the portfolio allocation because this is the most meaningful metric. Changes can be due to trades or changes in share prices.
| Security | Shares (MM) |
Value (MM$) |
Portfolio % | ΔPortfolio % |
|---|---|---|---|---|
| 0.00 | 0.00 | -1.7213 | ||
| 0.00 | 0.00 | -1.3110 | ||
| 0.09 | 16.06 | 2.4315 | -0.6882 | |
| 0.21 | 4.79 | 0.7246 | -0.6440 | |
| 0.21 | 12.29 | 1.8600 | -0.6189 | |
| 0.06 | 10.07 | 1.5249 | -0.5941 | |
| 0.03 | 7.11 | 1.0758 | -0.5836 | |
| 0.20 | 6.31 | 0.9558 | -0.4854 | |
| 0.14 | 14.50 | 2.1942 | -0.4766 | |
| 0.20 | 10.57 | 1.5992 | -0.4610 |
13F and Fund Filings
This form was filed on 2025-08-20 for the reporting period 2025-06-30. Click the link icon to see the full transaction history.
Upgrade to unlock premium data and export to Excel ![]() .
.
| Security | Type | Avg Share Price | Shares (MM) |
ΔShares (%) |
ΔShares (%) |
Value ($MM) |
Portfolio (%) |
ΔPortfolio (%) |
|
|---|---|---|---|---|---|---|---|---|---|
| HQY / HealthEquity, Inc. | 0.25 | -14.93 | 25.90 | 0.85 | 3.9207 | 0.4254 | |||
| CWST / Casella Waste Systems, Inc. | 0.22 | -3.10 | 25.47 | 0.27 | 3.8561 | 0.3984 | |||
| FOUR / Shift4 Payments, Inc. | 0.24 | -9.61 | 23.42 | 9.64 | 3.5444 | 0.6378 | |||
| PDFS / PDF Solutions, Inc. | 1.06 | 0.00 | 22.58 | 11.88 | 3.4180 | 0.6712 | |||
| FRPT / Freshpet, Inc. | 0.33 | 4.66 | 22.44 | -14.48 | 3.3967 | -0.1744 | |||
| FROG / JFrog Ltd. | 0.48 | -18.48 | 20.91 | 11.78 | 3.1648 | 0.6193 | |||
| EXAS / Exact Sciences Corporation | 0.38 | -17.11 | 20.11 | 1.75 | 3.0435 | 0.3543 | |||
| MNDY / monday.com Ltd. | 0.06 | -19.96 | 19.81 | 3.52 | 2.9983 | 0.3943 | |||
| NVMI / Nova Ltd. | 0.07 | -14.50 | 19.47 | 27.65 | 2.9473 | 0.8715 | |||
| CYBR / CyberArk Software Ltd. | 0.05 | -20.04 | 19.44 | -3.75 | 2.9423 | 0.1939 | |||
| RBC / RBC Bearings Incorporated | 0.05 | -14.29 | 18.35 | 2.51 | 2.7776 | 0.3413 | |||
| INSP / Inspire Medical Systems, Inc. | 0.14 | 8.84 | 18.29 | -11.32 | 2.7692 | -0.0384 | |||
| QTWO / Q2 Holdings, Inc. | 0.17 | 0.00 | 16.17 | 16.98 | 2.4481 | 0.5664 | |||
| OLLI / Ollie's Bargain Outlet Holdings, Inc. | 0.12 | -6.92 | 16.09 | 5.41 | 2.4352 | 0.3582 | |||
| PCTY / Paylocity Holding Corporation | 0.09 | -27.55 | 16.06 | -29.93 | 2.4315 | -0.6882 | |||
| PCOR / Procore Technologies, Inc. | 0.23 | 23.57 | 15.44 | 28.06 | 2.3364 | 0.6961 | |||
| ATRC / AtriCure, Inc. | 0.46 | 2.36 | 15.11 | 3.98 | 2.2879 | 0.3096 | |||
| GSHD / Goosehead Insurance, Inc | 0.14 | -17.35 | 14.50 | -26.14 | 2.1942 | -0.4766 | |||
| CSTL / Castle Biosciences, Inc. | 0.63 | 5.61 | 12.81 | 7.72 | 1.9386 | 0.3206 | |||
| TREX / Trex Company, Inc. | 0.23 | -2.58 | 12.40 | -8.82 | 1.8763 | 0.0263 | |||
| BRBR / BellRing Brands, Inc. | 0.21 | -13.29 | 12.29 | -32.54 | 1.8600 | -0.6189 | |||
| OZK / Bank OZK | 0.26 | -30.51 | 12.21 | -24.74 | 1.8489 | -0.3596 | |||
| KLIC / Kulicke and Soffa Industries, Inc. | 0.34 | -8.60 | 11.71 | -4.11 | 1.7726 | 0.1105 | |||
| SITM / SiTime Corporation | 0.05 | 7.53 | 11.68 | 49.90 | 1.7685 | 0.7077 | |||
| Johnnie-O Holdings, Inc. / EP (000000000) | 0.51 | 11.46 | 1.7347 | 1.7347 | |||||
| TMDX / TransMedics Group, Inc. | 0.08 | -56.32 | 11.26 | -12.99 | 1.7044 | -0.0568 | |||
| CERS / Cerus Corporation | 7.71 | 0.00 | 10.88 | 1.44 | 1.6462 | 0.1871 | |||
| CH1134540470 / On Holding AG | 0.20 | -41.11 | 10.57 | -30.21 | 1.5992 | -0.4610 | |||
| POOL / Pool Corporation | 0.04 | -20.30 | 10.41 | -27.03 | 1.5757 | -0.3656 | |||
| FND / Floor & Decor Holdings, Inc. | 0.13 | 0.00 | 10.25 | -5.61 | 1.5519 | 0.0738 | |||
| BCPC / Balchem Corporation | 0.06 | -32.54 | 10.07 | -35.30 | 1.5249 | -0.5941 | |||
| PRCT / PROCEPT BioRobotics Corporation | 0.17 | 32.80 | 9.87 | 31.30 | 1.4942 | 0.4710 | |||
| PHAT / Phathom Pharmaceuticals, Inc. | 1.01 | -31.21 | 9.69 | 5.22 | 1.4673 | 0.2135 | |||
| VECO / Veeco Instruments Inc. | 0.45 | 0.00 | 9.21 | 1.20 | 1.3946 | 0.1556 | |||
| CAMT / Camtek Ltd. | 0.10 | 16.77 | 8.52 | 68.43 | 1.2896 | 0.6011 | |||
| GLBE N / Global-E Online Ltd. | 0.25 | 8.45 | 1.2796 | 1.2796 | |||||
| FIVE / Five Below, Inc. | 0.06 | -57.83 | 8.30 | -26.17 | 1.2567 | -0.2737 | |||
| GLOB / Globant S.A. | 0.09 | -6.34 | 8.24 | -27.73 | 1.2472 | -0.3043 | |||
| BESI / BE Semiconductor Industries N.V. | 0.05 | 0.00 | 7.80 | 43.12 | 1.1807 | 0.4389 | |||
| MTDR / Matador Resources Company | 0.15 | -8.17 | 7.39 | -14.23 | 1.1187 | -0.0539 | |||
| CCCC / C4 Therapeutics, Inc. | 5.15 | 13.03 | 7.36 | 1.03 | 1.1147 | 0.1226 | |||
| MKTX / MarketAxess Holdings Inc. | 0.03 | -43.54 | 7.11 | -41.72 | 1.0758 | -0.5836 | |||
| ESPR / Esperion Therapeutics, Inc. | 7.02 | 5.17 | 6.91 | -28.10 | 1.0461 | -0.2620 | |||
| CRY / Artivion Inc | 0.20 | -52.87 | 6.31 | -40.37 | 0.9558 | -0.4854 | |||
| VKTX / Viking Therapeutics, Inc. | 0.23 | 0.00 | 5.97 | 9.74 | 0.9038 | 0.1633 | |||
| RXST / RxSight, Inc. | 0.41 | 15.57 | 5.27 | -40.50 | 0.7984 | -0.4080 | |||
| DYN / Dyne Therapeutics, Inc. | 0.51 | 8.23 | 4.85 | -1.48 | 0.7345 | 0.0641 | |||
| NRIX / Nurix Therapeutics, Inc. | 0.42 | 7.32 | 4.79 | 2.90 | 0.7257 | 0.0916 | |||
| MGY / Magnolia Oil & Gas Corporation | 0.21 | -46.51 | 4.79 | -52.40 | 0.7246 | -0.6440 | |||
| IMTX / Immatics N.V. | 0.72 | 35.52 | 3.89 | 61.64 | 0.5895 | 0.2617 | |||
| MGNX / MacroGenics, Inc. | 2.82 | 0.00 | 3.42 | -4.72 | 0.5170 | 0.0291 | |||
| ARVN / Arvinas, Inc. | 0.41 | 3.04 | 0.4603 | 0.4603 | |||||
| SGMO / Sangamo Therapeutics, Inc. | 5.59 | 23.44 | 3.03 | 1.92 | 0.4584 | 0.0539 | |||
| NKTX / Nkarta, Inc. | 1.59 | -14.33 | 2.63 | -22.71 | 0.3983 | -0.0650 | |||
| SGMO / Sangamo Therapeutics, Inc. | 3.03 | 0.30 | 0.0458 | 0.0458 | |||||
| BASE / Couchbase, Inc. | 0.00 | -100.00 | 0.00 | -100.00 | -1.3110 | ||||
| NCNO / nCino, Inc. | 0.00 | -100.00 | 0.00 | -100.00 | -1.7213 |