Basic Stats
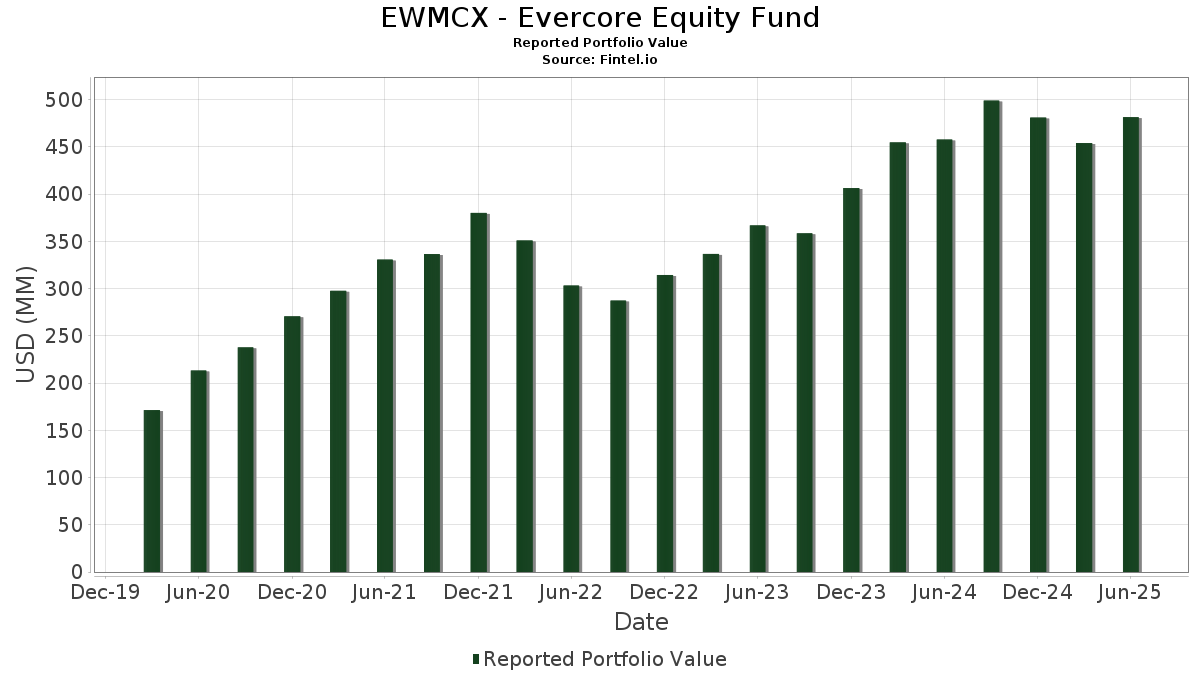
| Portfolio Value | $ 481,392,630 |
| Current Positions | 34 |
Latest Holdings, Performance, AUM (from 13F, 13D)
EWMCX - Evercore Equity Fund has disclosed 34 total holdings in their latest SEC filings. Most recent portfolio value is calculated to be $ 481,392,630 USD. Actual Assets Under Management (AUM) is this value plus cash (which is not disclosed). EWMCX - Evercore Equity Fund’s top holdings are NVIDIA Corporation (US:NVDA) , Microsoft Corporation (US:MSFT) , Apple Inc. (US:AAPL) , Amazon.com, Inc. (US:AMZN) , and Mastercard Incorporated (US:MA) .
Top Increases This Quarter
We use the change in the portfolio allocation because this is the most meaningful metric. Changes can be due to trades or changes in share prices.
| Security | Shares (MM) |
Value (MM$) |
Portfolio % | ΔPortfolio % |
|---|---|---|---|---|
| 0.24 | 37.65 | 7.8211 | 2.1253 | |
| 0.03 | 13.41 | 2.7848 | 1.4341 | |
| 0.06 | 29.37 | 6.1017 | 1.2710 | |
| 0.13 | 12.13 | 2.5196 | 0.7521 | |
| 0.27 | 14.31 | 2.9724 | 0.7501 | |
| 0.14 | 19.33 | 4.0146 | 0.6904 | |
| 0.10 | 18.19 | 3.7779 | 0.5041 | |
| 9.15 | 9.15 | 1.8998 | 0.4688 | |
| 0.12 | 7.97 | 1.6560 | 0.3620 | |
| 0.10 | 21.34 | 4.4340 | 0.3518 |
Top Decreases This Quarter
We use the change in the portfolio allocation because this is the most meaningful metric. Changes can be due to trades or changes in share prices.
| Security | Shares (MM) |
Value (MM$) |
Portfolio % | ΔPortfolio % |
|---|---|---|---|---|
| 0.03 | 9.61 | 1.9954 | -1.5610 | |
| 0.03 | 10.80 | 2.2434 | -0.6795 | |
| 0.10 | 21.37 | 4.4403 | -0.6633 | |
| 0.27 | 17.16 | 3.5653 | -0.4313 | |
| 0.04 | 9.28 | 1.9282 | -0.3463 | |
| 0.09 | 10.63 | 2.2080 | -0.3018 | |
| 0.05 | 13.32 | 2.7661 | -0.2948 | |
| 0.00 | 15.09 | 3.1348 | -0.2833 | |
| 0.11 | 11.44 | 2.3757 | -0.2689 | |
| 0.05 | 8.71 | 1.8087 | -0.2367 |
13F and Fund Filings
This form was filed on 2025-08-26 for the reporting period 2025-06-30. Click the link icon to see the full transaction history.
Upgrade to unlock premium data and export to Excel ![]() .
.
| Security | Type | Avg Share Price | Shares (MM) |
ΔShares (%) |
ΔShares (%) |
Value ($MM) |
Portfolio (%) |
ΔPortfolio (%) |
|
|---|---|---|---|---|---|---|---|---|---|
| NVDA / NVIDIA Corporation | 0.24 | 0.00 | 37.65 | 45.78 | 7.8211 | 2.1253 | |||
| MSFT / Microsoft Corporation | 0.06 | 1.20 | 29.37 | 34.09 | 6.1017 | 1.2710 | |||
| AAPL / Apple Inc. | 0.10 | 0.00 | 21.37 | -7.64 | 4.4403 | -0.6633 | |||
| AMZN / Amazon.com, Inc. | 0.10 | 0.00 | 21.34 | 15.31 | 4.4340 | 0.3518 | |||
| MA / Mastercard Incorporated | 0.04 | 0.00 | 19.95 | 2.52 | 4.1447 | -0.1472 | |||
| MS / Morgan Stanley | 0.14 | 6.19 | 19.33 | 28.21 | 4.0146 | 0.6904 | |||
| JPM / JPMorgan Chase & Co. | 0.07 | -12.75 | 18.85 | 3.12 | 3.9155 | -0.1156 | |||
| GOOG / Alphabet Inc. | 0.10 | 7.89 | 18.19 | 22.51 | 3.7779 | 0.5041 | |||
| WMB / The Williams Companies, Inc. | 0.27 | -9.89 | 17.16 | -5.29 | 3.5653 | -0.4313 | |||
| AZO / AutoZone, Inc. | 0.00 | 0.00 | 15.09 | -2.63 | 3.1348 | -0.2833 | |||
| HD / The Home Depot, Inc. | 0.04 | 0.00 | 14.90 | 0.04 | 3.0953 | -0.1894 | |||
| Viking Holdings Ltd / EC (BMG93A5A1010) | 0.27 | 5.92 | 14.31 | 42.00 | 2.9724 | 0.7501 | |||
| BX / Blackstone Inc. | 0.09 | 11.90 | 14.07 | 19.75 | 2.9228 | 0.3315 | |||
| CBRE / CBRE Group, Inc. | 0.10 | 0.00 | 13.59 | 7.14 | 2.8235 | 0.0258 | |||
| FIX / Comfort Systems USA, Inc. | 0.03 | 31.58 | 13.41 | 118.89 | 2.7848 | 1.4341 | |||
| CB / Chubb Limited | 0.05 | 0.00 | 13.32 | -4.06 | 2.7661 | -0.2948 | |||
| BLK / BlackRock, Inc. | 0.01 | 0.00 | 12.21 | 10.86 | 2.5361 | 0.1074 | |||
| UBER / Uber Technologies, Inc. | 0.13 | 18.18 | 12.13 | 51.35 | 2.5196 | 0.7521 | |||
| CROX / Crocs, Inc. | 0.11 | 0.00 | 11.44 | -4.63 | 2.3757 | -0.2689 | |||
| EOG / EOG Resources, Inc. | 0.10 | 15.05 | 11.43 | 7.32 | 2.3737 | 0.0255 | |||
| CDW / CDW Corporation | 0.06 | 0.00 | 11.16 | 11.45 | 2.3182 | 0.1098 | |||
| PGR / The Progressive Corporation | 0.04 | 15.71 | 10.81 | 9.11 | 2.2452 | 0.0607 | |||
| TMO / Thermo Fisher Scientific Inc. | 0.03 | 0.00 | 10.80 | -18.52 | 2.2434 | -0.6795 | |||
| BLDR / Builders FirstSource, Inc. | 0.09 | 0.00 | 10.63 | -6.61 | 2.2080 | -0.3018 | |||
| ACN / Accenture plc | 0.03 | 0.00 | 10.26 | -4.21 | 2.1313 | -0.2309 | |||
| UNH / UnitedHealth Group Incorporated | 0.03 | 0.00 | 9.61 | -40.44 | 1.9954 | -1.5610 | |||
| GNRC / Generac Holdings Inc. | 0.07 | 13.65 | 9.54 | 28.51 | 1.9814 | 0.3446 | |||
| AMT / American Tower Corporation | 0.04 | -11.39 | 9.28 | -10.01 | 1.9282 | -0.3463 | |||
| US8252528851 / Invesco Government & Agency Portfolio, Institutional Class | 9.15 | 40.94 | 9.15 | 40.95 | 1.8998 | 0.4688 | |||
| ANSS / ANSYS, Inc. | 0.03 | 0.00 | 8.85 | 10.94 | 1.8386 | 0.0793 | |||
| FI / Fiserv, Inc. | 0.05 | 20.24 | 8.71 | -6.12 | 1.8087 | -0.2367 | |||
| NVO / Novo Nordisk A/S - Depositary Receipt (Common Stock) | 0.12 | 36.69 | 7.97 | 35.86 | 1.6560 | 0.3620 | |||
| GOOGL / Alphabet Inc. | 0.04 | 0.00 | 7.90 | 13.97 | 1.6410 | 0.1123 | |||
| ADBE / Adobe Inc. | 0.02 | 0.00 | 7.64 | 0.87 | 1.5881 | -0.0833 |