Basic Stats
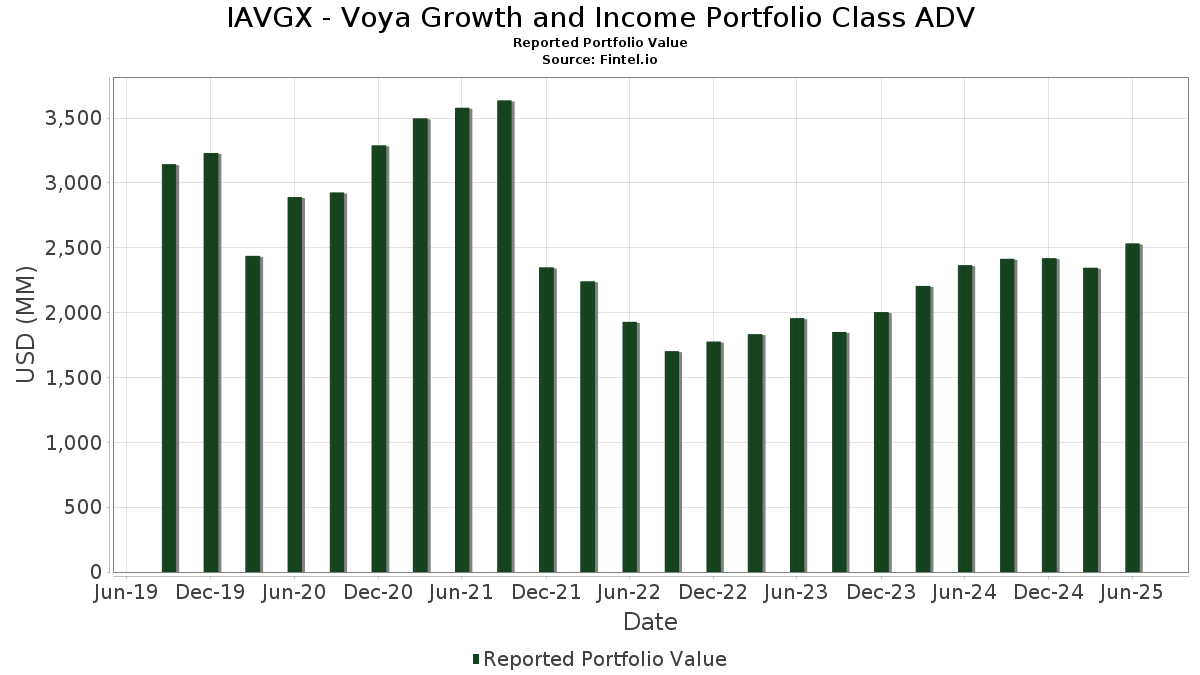
| Portfolio Value | $ 2,532,733,361 |
| Current Positions | 73 |
Latest Holdings, Performance, AUM (from 13F, 13D)
IAVGX - Voya Growth and Income Portfolio Class ADV has disclosed 73 total holdings in their latest SEC filings. Most recent portfolio value is calculated to be $ 2,532,733,361 USD. Actual Assets Under Management (AUM) is this value plus cash (which is not disclosed). IAVGX - Voya Growth and Income Portfolio Class ADV’s top holdings are Microsoft Corporation (US:MSFT) , Apple Inc. (US:AAPL) , Amazon.com, Inc. (US:AMZN) , Meta Platforms, Inc. (US:META) , and Broadcom Inc. (US:AVGO) . IAVGX - Voya Growth and Income Portfolio Class ADV’s new positions include Cisco Systems, Inc. (US:CSCO) , State Street Corporation (US:STT) , Pfizer Inc. (US:PFE) , Take-Two Interactive Software, Inc. (US:TTWO) , and Centene Corporation (US:CNC) .
Top Increases This Quarter
We use the change in the portfolio allocation because this is the most meaningful metric. Changes can be due to trades or changes in share prices.
| Security | Shares (MM) |
Value (MM$) |
Portfolio % | ΔPortfolio % |
|---|---|---|---|---|
| 0.42 | 208.40 | 8.2981 | 2.0432 | |
| 0.56 | 38.65 | 1.5392 | 1.5392 | |
| 0.38 | 103.76 | 4.1316 | 1.3241 | |
| 0.20 | 27.86 | 1.1095 | 1.1095 | |
| 0.26 | 27.42 | 1.0920 | 1.0920 | |
| 1.02 | 24.66 | 0.9818 | 0.9818 | |
| 0.10 | 24.07 | 0.9583 | 0.9583 | |
| 0.44 | 23.85 | 0.9496 | 0.9496 | |
| 0.11 | 22.58 | 0.8990 | 0.8990 | |
| 0.57 | 89.85 | 3.5777 | 0.8491 |
Top Decreases This Quarter
We use the change in the portfolio allocation because this is the most meaningful metric. Changes can be due to trades or changes in share prices.
| Security | Shares (MM) |
Value (MM$) |
Portfolio % | ΔPortfolio % |
|---|---|---|---|---|
| 0.77 | 157.14 | 6.2574 | -2.1966 | |
| 0.34 | 25.97 | 1.0342 | -0.9128 | |
| 0.05 | 23.54 | 0.9375 | -0.8433 | |
| 0.11 | 34.48 | 1.3730 | -0.6522 | |
| 1.52 | 31.78 | 1.2653 | -0.6469 | |
| 0.09 | 16.89 | 0.6726 | -0.5156 | |
| 0.24 | 34.97 | 1.3926 | -0.4162 | |
| 0.08 | 20.21 | 0.8046 | -0.4072 | |
| 0.13 | 11.53 | 0.4593 | -0.3722 | |
| 0.21 | 37.99 | 1.5128 | -0.3543 |
13F and Fund Filings
This form was filed on 2025-08-26 for the reporting period 2025-06-30. Click the link icon to see the full transaction history.
Upgrade to unlock premium data and export to Excel ![]() .
.
| Security | Type | Avg Share Price | Shares (MM) |
ΔShares (%) |
ΔShares (%) |
Value ($MM) |
Portfolio (%) |
ΔPortfolio (%) |
|
|---|---|---|---|---|---|---|---|---|---|
| MSFT / Microsoft Corporation | 0.42 | 7.16 | 208.40 | 41.99 | 8.2981 | 2.0432 | |||
| AAPL / Apple Inc. | 0.77 | -14.23 | 157.14 | -20.78 | 6.2574 | -2.1966 | |||
| AMZN / Amazon.com, Inc. | 0.54 | -3.73 | 117.38 | 11.01 | 4.6741 | 0.1675 | |||
| META / Meta Platforms, Inc. | 0.15 | -3.73 | 112.28 | 23.28 | 4.4711 | 0.5894 | |||
| AVGO / Broadcom Inc. | 0.38 | -4.33 | 103.76 | 57.51 | 4.1316 | 1.3241 | |||
| NVDA / NVIDIA Corporation | 0.57 | -3.73 | 89.85 | 40.33 | 3.5777 | 0.8491 | |||
| TSM / Taiwan Semiconductor Manufacturing Company Limited - Depositary Receipt (Common Stock) | 0.24 | 23.45 | 54.77 | 68.44 | 2.1808 | 0.7951 | |||
| T / AT&T Inc. | 1.61 | -3.73 | 46.58 | -1.48 | 1.8547 | -0.1603 | |||
| MU / Micron Technology, Inc. | 0.38 | 32.67 | 46.29 | 88.19 | 1.8434 | 0.7950 | |||
| BA / The Boeing Company | 0.22 | -17.95 | 45.50 | 0.80 | 1.8117 | -0.1119 | |||
| V / Visa Inc. | 0.12 | -3.73 | 44.21 | -2.47 | 1.7604 | -0.1715 | |||
| AIG / American International Group, Inc. | 0.50 | 8.33 | 43.06 | 6.65 | 1.7148 | -0.0061 | |||
| EXE / Expand Energy Corporation | 0.36 | -3.73 | 41.89 | 1.13 | 1.6679 | -0.0973 | |||
| MMM / 3M Company | 0.27 | 41.74 | 41.56 | 46.94 | 1.6547 | 0.4494 | |||
| WELL / Welltower Inc. | 0.27 | -3.73 | 41.13 | -3.41 | 1.6377 | -0.1769 | |||
| TYIA / Johnson Controls International plc | 0.38 | -3.73 | 40.04 | 26.92 | 1.5945 | 0.2499 | |||
| BAC / Bank of America Corporation | 0.83 | -3.73 | 39.18 | 9.16 | 1.5603 | 0.0305 | |||
| DE / Deere & Company | 0.08 | -3.73 | 38.77 | 4.30 | 1.5437 | -0.0405 | |||
| CSCO / Cisco Systems, Inc. | 0.56 | 38.65 | 1.5392 | 1.5392 | |||||
| PM / Philip Morris International Inc. | 0.21 | -24.42 | 37.99 | -13.28 | 1.5128 | -0.3543 | |||
| WBD / Warner Bros. Discovery, Inc. | 3.31 | -3.73 | 37.97 | 2.82 | 1.5119 | -0.0620 | |||
| ABT / Abbott Laboratories | 0.28 | -3.73 | 37.74 | -1.29 | 1.5028 | -0.1267 | |||
| ABBV / AbbVie Inc. | 0.20 | 7.84 | 36.64 | 12.64 | 1.4590 | 0.1144 | |||
| GS / The Goldman Sachs Group, Inc. | 0.05 | -3.73 | 36.61 | 24.72 | 1.4578 | 0.2068 | |||
| ACI / Albertsons Companies, Inc. | 1.70 | -7.75 | 36.48 | -9.76 | 1.4526 | -0.2703 | |||
| WFC / Wells Fargo & Company | 0.45 | -3.73 | 36.00 | 7.44 | 1.4335 | 0.0055 | |||
| CVX / Chevron Corporation | 0.24 | -3.73 | 34.97 | -17.60 | 1.3926 | -0.4162 | |||
| AJG / Arthur J. Gallagher & Co. | 0.11 | -21.75 | 34.48 | -27.44 | 1.3730 | -0.6522 | |||
| BK / The Bank of New York Mellon Corporation | 0.37 | -3.43 | 33.81 | 4.91 | 1.3462 | -0.0272 | |||
| BKNG / Booking Holdings Inc. | 0.01 | -3.72 | 33.39 | 20.99 | 1.3297 | 0.1534 | |||
| PEG / Public Service Enterprise Group Incorporated | 0.38 | 33.60 | 31.99 | 36.65 | 1.2738 | 0.2761 | |||
| KVUE / Kenvue Inc. | 1.52 | -18.86 | 31.78 | -29.18 | 1.2653 | -0.6469 | |||
| ICE / Intercontinental Exchange, Inc. | 0.17 | -3.73 | 31.62 | 2.39 | 1.2592 | -0.0570 | |||
| DUK / Duke Energy Corporation | 0.27 | -3.73 | 31.59 | -6.86 | 1.2577 | -0.1876 | |||
| DINO / HF Sinclair Corporation | 0.70 | 30.80 | 28.64 | 63.42 | 1.1404 | 0.3935 | |||
| AMD / Advanced Micro Devices, Inc. | 0.20 | 27.86 | 1.1095 | 1.1095 | |||||
| STT / State Street Corporation | 0.26 | 27.42 | 1.0920 | 1.0920 | |||||
| MCK / McKesson Corporation | 0.04 | -22.27 | 26.58 | -15.36 | 1.0584 | -0.2800 | |||
| ACN / Accenture plc | 0.09 | 4.88 | 26.14 | -10.89 | 1.0410 | -0.1718 | |||
| MKC / McCormick & Company, Incorporated | 0.34 | -38.28 | 25.97 | -43.15 | 1.0342 | -0.9128 | |||
| PNC / The PNC Financial Services Group, Inc. | 0.14 | -3.73 | 25.72 | 2.10 | 1.0240 | -0.0494 | |||
| ADBE / Adobe Inc. | 0.07 | 2.52 | 25.54 | 3.42 | 1.0170 | -0.0355 | |||
| PFE / Pfizer Inc. | 1.02 | 24.66 | 0.9818 | 0.9818 | |||||
| SYK / Stryker Corporation | 0.06 | -3.73 | 24.58 | 2.31 | 0.9787 | -0.0451 | |||
| TTWO / Take-Two Interactive Software, Inc. | 0.10 | 24.07 | 0.9583 | 0.9583 | |||||
| CNC / Centene Corporation | 0.44 | 23.85 | 0.9496 | 0.9496 | |||||
| VRTX / Vertex Pharmaceuticals Incorporated | 0.05 | -38.64 | 23.54 | -43.66 | 0.9375 | -0.8433 | |||
| PH / Parker-Hannifin Corporation | 0.03 | -3.73 | 23.24 | 10.62 | 0.9255 | 0.0300 | |||
| DHR / Danaher Corporation | 0.11 | 22.58 | 0.8990 | 0.8990 | |||||
| PINS / Pinterest, Inc. | 0.61 | -3.73 | 22.02 | 11.36 | 0.8770 | 0.0341 | |||
| BXP / Boston Properties, Inc. | 0.30 | -3.73 | 20.27 | -3.33 | 0.8072 | -0.0865 | |||
| WDAY / Workday, Inc. | 0.08 | -30.85 | 20.21 | -28.94 | 0.8046 | -0.4072 | |||
| MTD / Mettler-Toledo International Inc. | 0.02 | -3.74 | 19.86 | -4.24 | 0.7908 | -0.0931 | |||
| LOW / Lowe's Companies, Inc. | 0.09 | -3.73 | 19.26 | -8.42 | 0.7670 | -0.1294 | |||
| EXR / Extra Space Storage Inc. | 0.13 | -3.73 | 18.63 | -4.41 | 0.7417 | -0.0888 | |||
| AA / Alcoa Corporation | 0.63 | 23.49 | 18.56 | 19.48 | 0.7392 | 0.0770 | |||
| US61747C7074 / Morgan Stanley Institutional Liquidity Funds Government Portfolio, Institutional Class | 17.90 | -11.10 | 17.90 | -11.10 | 0.7128 | -0.1453 | |||
| CF / CF Industries Holdings, Inc. | 0.19 | -3.73 | 17.38 | 13.33 | 0.6921 | 0.0385 | |||
| DGX / Quest Diagnostics Incorporated | 0.09 | -45.56 | 16.89 | -29.08 | 0.6726 | -0.5156 | |||
| NUE / Nucor Corporation | 0.12 | -3.73 | 15.49 | 3.63 | 0.6168 | -0.0202 | |||
| WSM / Williams-Sonoma, Inc. | 0.08 | -34.44 | 13.57 | -32.26 | 0.5405 | -0.3135 | |||
| SAIA / Saia, Inc. | 0.05 | -3.73 | 13.26 | -24.51 | 0.5280 | -0.2207 | |||
| TPR / Tapestry, Inc. | 0.15 | -3.73 | 13.16 | 20.06 | 0.5240 | 0.0569 | |||
| GLOB / Globant S.A. | 0.13 | -23.38 | 11.53 | -40.88 | 0.4593 | -0.3722 | |||
| CANTOR FITZGERALD SECURITIES / RA (000000000) | 4.98 | 0.1982 | 0.1982 | ||||||
| DAIWA CAPITAL MARKETS AMERICA INC / RA (000000000) | 4.98 | 0.1982 | 0.1982 | ||||||
| STATE OF WISCONSIN INVESTMENT BOARD / RA (000000000) | 4.73 | 0.1883 | 0.1883 | ||||||
| HSBC SECURITIES (USA) INC / RA (000000000) | 3.47 | 0.1383 | 0.1383 | ||||||
| BNP PARIBAS SA / RA (000000000) | 0.71 | 0.0282 | 0.0282 | ||||||
| MIZUHO BANK LTD (NEW YORK BRANCH) / DBT (000000000) | 0.50 | 0.0199 | 0.0199 | ||||||
| ROYAL BANK OF CANADA (TORONTO BRANCH) / DBT (000000000) | 0.50 | 0.0199 | 0.0199 | ||||||
| CANADIAN IMPERIAL BANK OF COMMERCE (TORONTO BRANCH) / DBT (000000000) | 0.48 | 0.0191 | 0.0191 | ||||||
| LANDESBANK HESSEN THUERINGEN GIROZENTRALE(NEW YORK BRANCH) / DBT (000000000) | 0.48 | 0.0191 | 0.0191 | ||||||
| MIRANT CORP 144A ESCROW / (000000000) | 0.00 | 0.0000 | 0.0000 |