Basic Stats
| Portfolio Value | $ 103,469,000 |
| Current Positions | 51 |
Latest Holdings, Performance, AUM (from 13F, 13D)
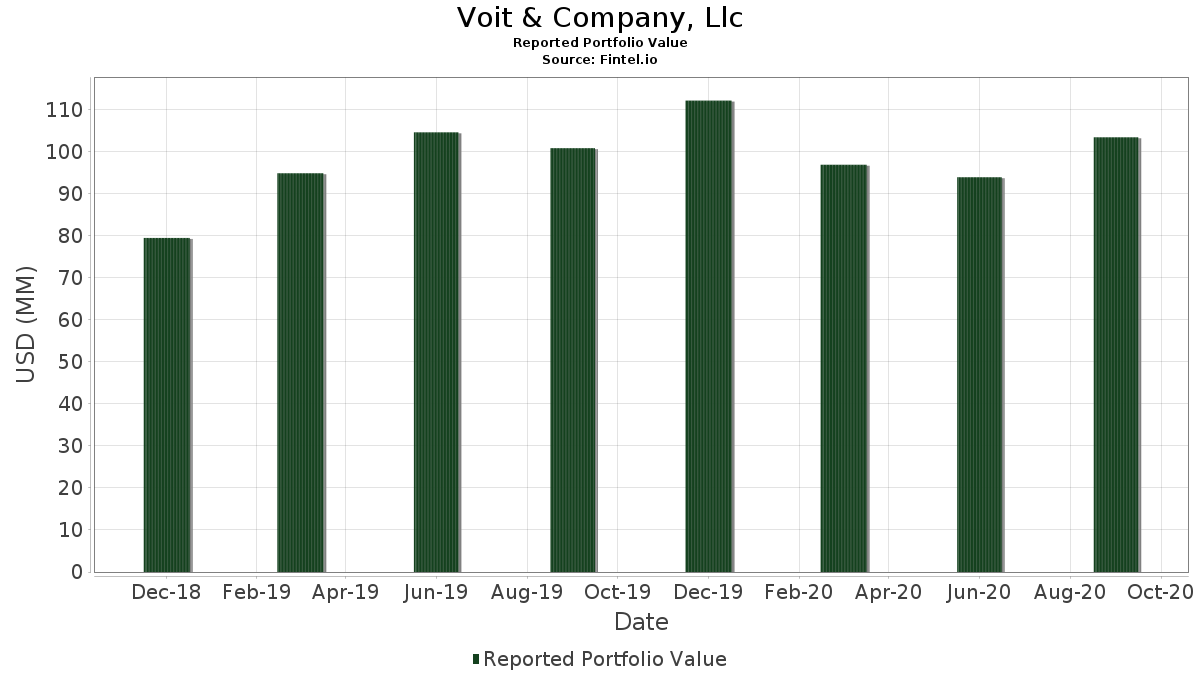
Voit & Company, Llc has disclosed 51 total holdings in their latest SEC filings. Most recent portfolio value is calculated to be $ 103,469,000 USD. Actual Assets Under Management (AUM) is this value plus cash (which is not disclosed). Voit & Company, Llc’s top holdings are Amazon.com, Inc. (US:AMZN) , Apple Inc. (US:AAPL) , WEC Energy Group, Inc. (US:WEC) , Visa Inc. (US:V) , and SPDR Gold Trust (US:GLD) . Voit & Company, Llc’s new positions include Fiserv, Inc. (US:FISV) , Sprouts Farmers Market, Inc. (US:SFM) , .
Top Increases This Quarter
We use the change in the portfolio allocation because this is the most meaningful metric. Changes can be due to trades or changes in share prices.
| Security | Shares (MM) |
Value (MM$) |
Portfolio % | ΔPortfolio % |
|---|---|---|---|---|
| 0.06 | 4.72 | 4.5666 | 0.9066 | |
| 0.01 | 4.07 | 3.9287 | 0.8924 | |
| 0.01 | 0.52 | 0.5045 | 0.5045 | |
| 0.02 | 0.49 | 0.4716 | 0.4716 | |
| 0.01 | 5.11 | 4.9358 | 0.4713 | |
| 0.06 | 5.41 | 5.2248 | 0.4665 | |
| 0.03 | 4.60 | 4.4429 | 0.4317 | |
| 0.02 | 0.86 | 0.8312 | 0.4065 | |
| 0.04 | 3.50 | 3.3798 | 0.4052 | |
| 0.01 | 2.65 | 2.5573 | 0.3979 |
Top Decreases This Quarter
We use the change in the portfolio allocation because this is the most meaningful metric. Changes can be due to trades or changes in share prices.
| Security | Shares (MM) |
Value (MM$) |
Portfolio % | ΔPortfolio % |
|---|---|---|---|---|
| 0.00 | 0.00 | -1.6177 | ||
| 0.05 | 4.42 | 4.2699 | -0.9481 | |
| 0.01 | 2.57 | 2.4800 | -0.7873 | |
| 0.00 | 6.43 | 6.2173 | -0.6301 | |
| 0.02 | 1.36 | 1.3144 | -0.4544 | |
| 0.00 | 0.00 | -0.3544 | ||
| 0.02 | 1.02 | 0.9897 | -0.3406 | |
| 0.01 | 1.13 | 1.0892 | -0.2986 | |
| 0.06 | 0.80 | 0.7683 | -0.2959 | |
| 0.00 | 0.44 | 0.4252 | -0.2772 |
13F and Fund Filings
This form was filed on 2020-10-30 for the reporting period 2020-09-30. Click the link icon to see the full transaction history.
Upgrade to unlock premium data and export to Excel ![]() .
.
| Security | Type | Avg Share Price | Shares (MM) |
ΔShares (%) |
ΔShares (%) |
Value ($MM) |
Portfolio (%) |
ΔPortfolio (%) |
|
|---|---|---|---|---|---|---|---|---|---|
| AMZN / Amazon.com, Inc. | 0.00 | -12.39 | 6.43 | -0.02 | 6.2173 | -0.6301 | |||
| AAPL / Apple Inc. | 0.05 | 252.08 | 5.92 | 11.78 | 5.7215 | 0.0853 | |||
| WEC / WEC Energy Group, Inc. | 0.06 | 9.36 | 5.41 | 20.91 | 5.2248 | 0.4665 | |||
| V / Visa Inc. | 0.03 | 4.97 | 5.38 | 8.68 | 5.2045 | -0.0689 | |||
| GLD / SPDR Gold Trust | 0.03 | 5.23 | 5.23 | 11.36 | 5.0585 | 0.0566 | |||
| TMO / Thermo Fisher Scientific Inc. | 0.01 | -0.07 | 5.11 | 21.74 | 4.9358 | 0.4713 | |||
| DHI / D.R. Horton, Inc. | 0.06 | 0.73 | 4.72 | 37.39 | 4.5666 | 0.9066 | |||
| HON / Honeywell International Inc. | 0.03 | 7.16 | 4.60 | 21.97 | 4.4429 | 0.4317 | |||
| KMB / Kimberly-Clark Corporation | 0.03 | 7.24 | 4.51 | 12.02 | 4.3588 | 0.0741 | |||
| ABBV / AbbVie Inc. | 0.05 | 1.01 | 4.42 | -9.89 | 4.2699 | -0.9481 | |||
| NVDA / NVIDIA Corporation | 0.01 | 0.03 | 4.07 | 42.48 | 3.9287 | 0.8924 | |||
| SBUX / Starbucks Corporation | 0.04 | 7.15 | 3.50 | 25.12 | 3.3798 | 0.4052 | |||
| ADBE / Adobe Inc. | 0.01 | 5.98 | 3.01 | 19.41 | 2.9129 | 0.2268 | |||
| SCHB / Schwab Strategic Trust - Schwab U.S. Broad Market ETF | 0.03 | -3.00 | 2.73 | 5.17 | 2.6346 | -0.1239 | |||
| CRM / Salesforce, Inc. | 0.01 | -2.82 | 2.65 | 30.41 | 2.5573 | 0.3979 | |||
| ILMN / Illumina, Inc. | 0.01 | 0.14 | 2.57 | -16.42 | 2.4800 | -0.7873 | |||
| CCK / Crown Holdings, Inc. | 0.03 | -6.70 | 2.54 | 10.11 | 2.4519 | -0.0001 | |||
| CTAS / Cintas Corporation | 0.01 | 0.14 | 2.40 | 25.08 | 2.3234 | 0.2779 | |||
| COST / Costco Wholesale Corporation | 0.01 | 2.37 | 2.18 | 19.89 | 2.1030 | 0.1714 | |||
| BAC / Bank of America Corporation | 0.09 | -0.25 | 2.13 | 1.19 | 2.0547 | -0.1813 | |||
| DIS / The Walt Disney Company | 0.02 | 8.36 | 2.08 | 20.56 | 2.0064 | 0.1738 | |||
| ORLY / O'Reilly Automotive, Inc. | 0.00 | -0.13 | 1.79 | 9.20 | 1.7319 | -0.0145 | |||
| UNP / Union Pacific Corporation | 0.01 | 0.38 | 1.78 | 16.91 | 1.7242 | 0.1001 | |||
| CVX / Chevron Corporation | 0.02 | 1.43 | 1.36 | -18.17 | 1.3144 | -0.4544 | |||
| ETN / Eaton Corporation plc | 0.01 | -13.70 | 1.21 | 0.66 | 1.1714 | -0.1100 | |||
| NVS / Novartis AG - Depositary Receipt (Common Stock) | 0.01 | -13.22 | 1.13 | -13.57 | 1.0892 | -0.2986 | |||
| MMC / Marsh & McLennan Companies, Inc. | 0.01 | 0.21 | 1.07 | 7.09 | 1.0361 | -0.0293 | |||
| IBM / International Business Machines Corporation | 0.01 | 43.71 | 1.06 | 44.82 | 1.0274 | 0.2462 | |||
| MU / Micron Technology, Inc. | 0.02 | -10.12 | 1.02 | -18.08 | 0.9897 | -0.3406 | |||
| NOC / Northrop Grumman Corporation | 0.00 | 0.44 | 0.93 | 3.10 | 0.8988 | -0.0611 | |||
| HD / The Home Depot, Inc. | 0.00 | 0.55 | 0.86 | 11.35 | 0.8341 | 0.0093 | |||
| REGI / Renewable Energy Group Inc | 0.02 | 0.00 | 0.86 | 115.54 | 0.8312 | 0.4065 | |||
| SCHF / Schwab Strategic Trust - Schwab International Equity ETF | 0.03 | -3.36 | 0.86 | 2.02 | 0.8283 | -0.0657 | |||
| SSD / Simpson Manufacturing Co., Inc. | 0.01 | 0.23 | 0.84 | 15.54 | 0.8118 | 0.0381 | |||
| SCHE / Schwab Strategic Trust - Schwab Emerging Markets Equity ETF | 0.03 | -6.76 | 0.81 | 2.52 | 0.7867 | -0.0583 | |||
| KMI / Kinder Morgan, Inc. | 0.06 | -2.22 | 0.80 | -20.50 | 0.7683 | -0.2959 | |||
| HASI / HA Sustainable Infrastructure Capital, Inc. | 0.02 | 3.24 | 0.71 | 53.48 | 0.6823 | 0.1928 | |||
| MELI / MercadoLibre, Inc. | 0.00 | -6.21 | 0.62 | 2.99 | 0.6002 | -0.0416 | |||
| AOS / A. O. Smith Corporation | 0.01 | 72.27 | 0.55 | 93.03 | 0.5354 | 0.2300 | |||
| FISV / Fiserv, Inc. | 0.01 | 0.52 | 0.5045 | 0.5045 | |||||
| BCPC / Balchem Corporation | 0.01 | 1.82 | 0.52 | 4.86 | 0.5006 | -0.0251 | |||
| SFM / Sprouts Farmers Market, Inc. | 0.02 | 0.49 | 0.4716 | 0.4716 | |||||
| JBSS / John B. Sanfilippo & Son, Inc. | 0.01 | 2.67 | 0.47 | -9.21 | 0.4571 | -0.0973 | |||
| DOCU / DocuSign, Inc. | 0.00 | -46.61 | 0.44 | -33.33 | 0.4252 | -0.2772 | |||
| USB / U.S. Bancorp | 0.01 | 1.10 | 0.41 | -1.44 | 0.3972 | -0.0466 | |||
| PLAB / Photronics, Inc. | 0.03 | -24.37 | 0.28 | -32.37 | 0.2725 | -0.1712 | |||
| GNRC / Generac Holdings Inc. | 0.00 | -43.88 | 0.23 | -10.63 | 0.2194 | -0.0509 | |||
| NXP / Nuveen Select Tax-Free Income Portfolio | 0.01 | 0.84 | 0.20 | 7.37 | 0.1972 | -0.0050 | |||
| SPY / SPDR S&P 500 ETF | Put | 0.01 | 0.05 | 0.0474 | 0.0474 | ||||
| SPY / SPDR S&P 500 ETF | 0.00 | 0.01 | 0.0077 | 0.0077 | |||||
| NVS / Novartis AG - Depositary Receipt (Common Stock) | Call | 0.00 | 0.01 | 0.0048 | 0.0048 | ||||
| CB / Chubb Limited | 0.00 | -100.00 | 0.00 | -100.00 | -1.6177 | ||||
| VOYA / Voya Financial, Inc. | 0.00 | -100.00 | 0.00 | -100.00 | -0.3544 | ||||
| MCS / The Marcus Corporation | 0.00 | -100.00 | 0.00 | -100.00 | -0.1415 |