Basic Stats
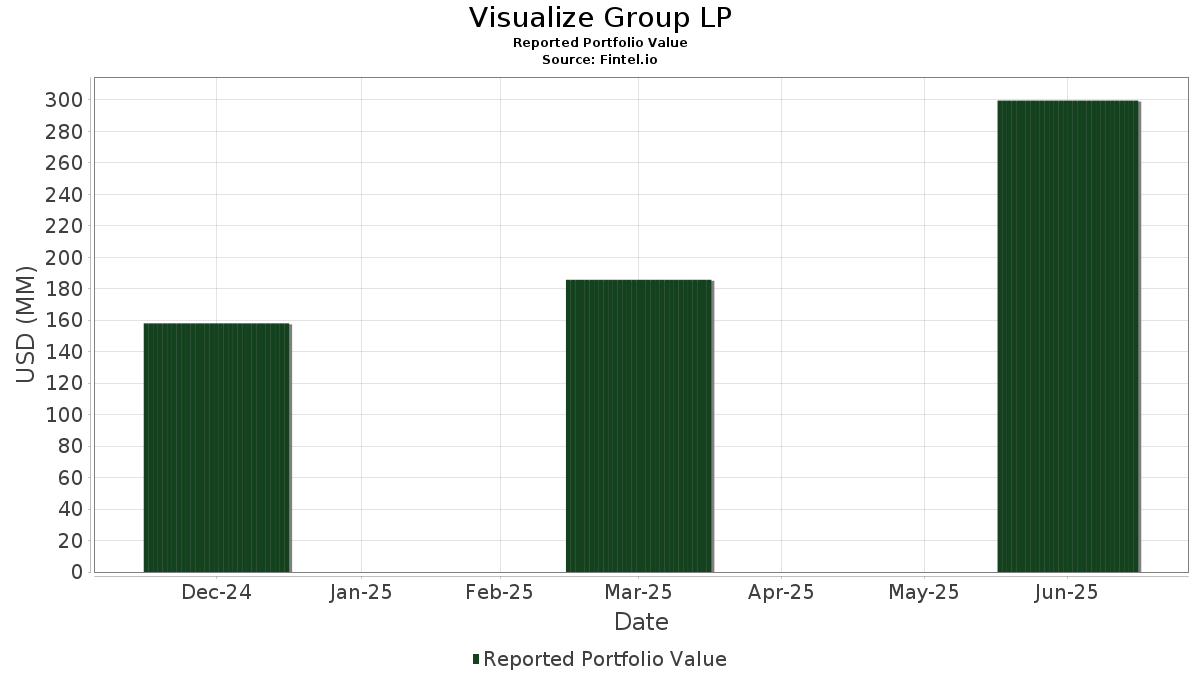
| Portfolio Value | $ 299,576,505 |
| Current Positions | 11 |
Latest Holdings, Performance, AUM (from 13F, 13D)
Visualize Group LP has disclosed 11 total holdings in their latest SEC filings. Most recent portfolio value is calculated to be $ 299,576,505 USD. Actual Assets Under Management (AUM) is this value plus cash (which is not disclosed). Visualize Group LP’s top holdings are i3 Verticals, Inc. (US:IIIV) , Waste Connections, Inc. (US:WCN) , Republic Services, Inc. (US:RSG) , Heico Corp. - Class A (US:HEIA) , and Autodesk, Inc. (US:ADSK) .
Top Increases This Quarter
We use the change in the portfolio allocation because this is the most meaningful metric. Changes can be due to trades or changes in share prices.
| Security | Shares (MM) |
Value (MM$) |
Portfolio % | ΔPortfolio % |
|---|---|---|---|---|
| 0.29 | 55.02 | 18.3674 | 16.0575 | |
| 0.14 | 33.76 | 11.2691 | 3.8805 | |
| 0.02 | 16.94 | 5.6542 | 3.4895 | |
| 0.02 | 15.11 | 5.0447 | 2.1446 | |
| 0.40 | 32.49 | 10.8449 | 0.8660 | |
| 0.16 | 28.64 | 9.5601 | 0.6917 | |
| 0.31 | 33.93 | 11.3244 | 0.4064 | |
| 0.11 | 27.51 | 9.1846 | 0.3391 |
Top Decreases This Quarter
We use the change in the portfolio allocation because this is the most meaningful metric. Changes can be due to trades or changes in share prices.
| Security | Shares (MM) |
Value (MM$) |
Portfolio % | ΔPortfolio % |
|---|---|---|---|---|
| 0.08 | 11.23 | 3.7498 | -8.7869 | |
| 0.08 | 9.11 | 3.0413 | -7.5031 | |
| 0.12 | 35.83 | 11.9595 | -6.9846 |
13F and Fund Filings
This form was filed on 2025-08-14 for the reporting period 2025-06-30. Click the link icon to see the full transaction history.
Upgrade to unlock premium data and export to Excel ![]() .
.
| Security | Type | Avg Share Price | Shares (MM) |
ΔShares (%) |
ΔShares (%) |
Value ($MM) |
Portfolio (%) |
ΔPortfolio (%) |
|
|---|---|---|---|---|---|---|---|---|---|
| IIIV / i3 Verticals, Inc. | 0.29 | 3.66 | 55.02 | 684.60 | 18.3674 | 16.0575 | |||
| WCN / Waste Connections, Inc. | 0.12 | -60.73 | 35.83 | -37.71 | 11.9595 | -6.9846 | |||
| RSG / Republic Services, Inc. | 0.31 | 123.52 | 33.93 | 2.34 | 11.3244 | 0.4064 | |||
| HEIA / Heico Corp. - Class A | 0.14 | 28.74 | 33.76 | 50.48 | 11.2691 | 3.8805 | |||
| ADSK / Autodesk, Inc. | 0.40 | 249.15 | 32.49 | 7.22 | 10.8449 | 0.8660 | |||
| ICE / Intercontinental Exchange, Inc. | 0.16 | 0.00 | 28.64 | 6.36 | 9.5601 | 0.6917 | |||
| FI / Fiserv, Inc. | 0.11 | -12.57 | 27.51 | 2.45 | 9.1846 | 0.3391 | |||
| SPY / SPDR S&P 500 ETF | 0.02 | 40.22 | 16.94 | 157.73 | 5.6542 | 3.4895 | |||
| CWST / Casella Waste Systems, Inc. | 0.02 | -75.06 | 15.11 | 71.63 | 5.0447 | 2.1446 | |||
| BRO / Brown & Brown, Inc. | 0.08 | -75.46 | 11.23 | -70.49 | 3.7498 | -8.7869 | |||
| CSGP / CoStar Group, Inc. | 0.08 | -80.46 | 9.11 | -71.54 | 3.0413 | -7.5031 | |||
| NOW / ServiceNow, Inc. | 0.00 | -100.00 | 0.00 | 0.0000 | |||||
| RSP / Invesco Exchange-Traded Fund Trust - Invesco S&P 500 Equal Weight ETF | 0.00 | -100.00 | 0.00 | 0.0000 | |||||
| SEAT / Vivid Seats Inc. | 0.00 | -100.00 | 0.00 | 0.0000 |