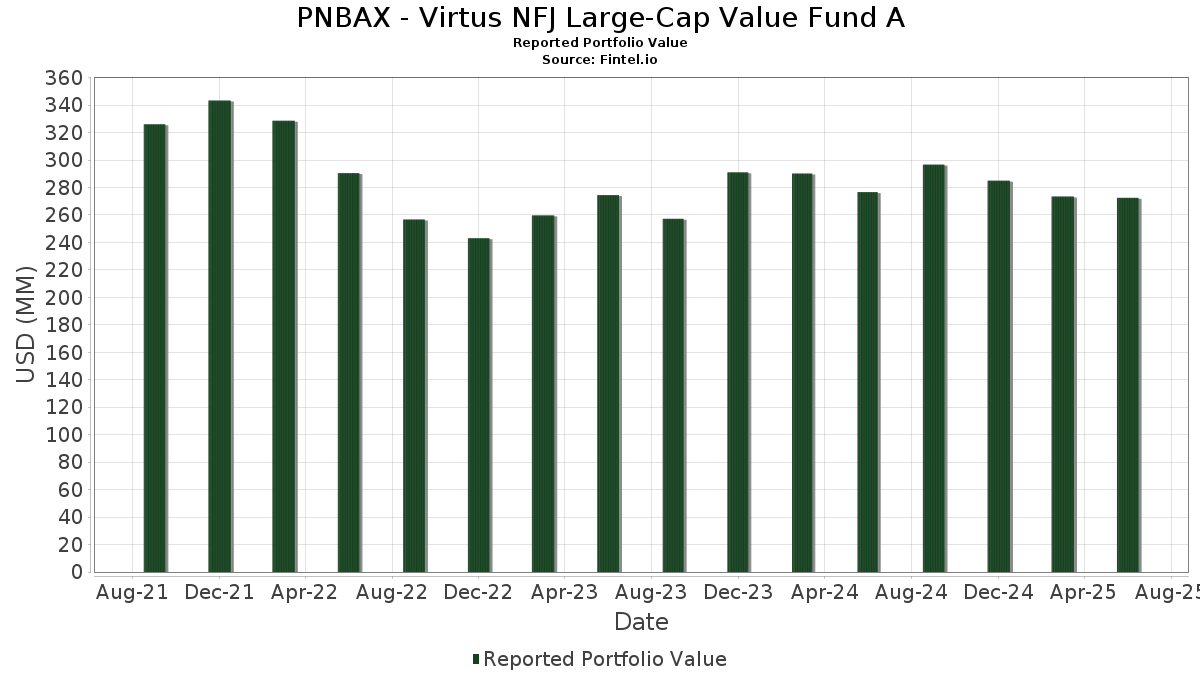
Basic Stats
| Portfolio Value | $ 272,454,384 |
| Current Positions | 98 |
Latest Holdings, Performance, AUM (from 13F, 13D)
PNBAX - Virtus NFJ Large-Cap Value Fund A has disclosed 98 total holdings in their latest SEC filings. Most recent portfolio value is calculated to be $ 272,454,384 USD. Actual Assets Under Management (AUM) is this value plus cash (which is not disclosed). PNBAX - Virtus NFJ Large-Cap Value Fund A’s top holdings are JPMorgan Chase & Co. (US:JPM) , NextEra Energy, Inc. (US:NEE) , Bank of America Corporation (US:BAC) , The PNC Financial Services Group, Inc. (US:PNC) , and Eversource Energy (US:ES) . PNBAX - Virtus NFJ Large-Cap Value Fund A’s new positions include Oshkosh Corporation (US:OSK) , Eaton Corporation plc (US:ETN) , American Express Company (US:AXP) , Southwest Airlines Co. (US:LUV) , and Freeport-McMoRan Inc. (US:FCX) .
Top Increases This Quarter
We use the change in the portfolio allocation because this is the most meaningful metric. Changes can be due to trades or changes in share prices.
| Security | Shares (MM) |
Value (MM$) |
Portfolio % | ΔPortfolio % |
|---|---|---|---|---|
| 0.02 | 4.06 | 1.4828 | 1.0290 | |
| 0.02 | 2.80 | 1.0209 | 1.0209 | |
| 0.03 | 9.41 | 3.4350 | 0.8348 | |
| 0.02 | 3.22 | 1.1756 | 0.7504 | |
| 0.04 | 3.22 | 1.1749 | 0.7486 | |
| 0.06 | 4.48 | 1.6345 | 0.6993 | |
| 0.00 | 1.72 | 0.6291 | 0.6291 | |
| 0.00 | 1.50 | 0.5468 | 0.5468 | |
| 0.05 | 1.49 | 0.5433 | 0.5433 | |
| 0.03 | 1.46 | 0.5348 | 0.5348 |
Top Decreases This Quarter
We use the change in the portfolio allocation because this is the most meaningful metric. Changes can be due to trades or changes in share prices.
| Security | Shares (MM) |
Value (MM$) |
Portfolio % | ΔPortfolio % |
|---|---|---|---|---|
| 0.01 | 2.82 | 1.0309 | -1.2026 | |
| 0.02 | 1.12 | 0.4098 | -0.6853 | |
| 0.07 | 1.40 | 0.5112 | -0.6459 | |
| 0.05 | 1.40 | 0.5113 | -0.5331 | |
| 0.02 | 1.29 | 0.4700 | -0.5193 | |
| 0.01 | 1.40 | 0.5129 | -0.4700 | |
| 0.00 | 1.32 | 0.4830 | -0.4421 | |
| 0.05 | 2.29 | 0.8365 | -0.4276 | |
| 0.05 | 5.14 | 1.8758 | -0.3342 | |
| 0.03 | 3.89 | 1.4194 | -0.2431 |
13F and Fund Filings
This form was filed on 2025-08-26 for the reporting period 2025-06-30. Click the link icon to see the full transaction history.
Upgrade to unlock premium data and export to Excel ![]() .
.
| Security | Type | Avg Share Price | Shares (MM) |
ΔShares (%) |
ΔShares (%) |
Value ($MM) |
Portfolio (%) |
ΔPortfolio (%) |
|
|---|---|---|---|---|---|---|---|---|---|
| JPM / JPMorgan Chase & Co. | 0.03 | 10.94 | 9.41 | 31.12 | 3.4350 | 0.8348 | |||
| NEE / NextEra Energy, Inc. | 0.11 | -1.00 | 7.97 | -3.05 | 2.9097 | -0.0692 | |||
| BAC / Bank of America Corporation | 0.15 | -8.04 | 7.14 | 4.28 | 2.6076 | 0.1256 | |||
| PNC / The PNC Financial Services Group, Inc. | 0.03 | -1.00 | 5.76 | 5.00 | 2.1022 | 0.1151 | |||
| ES / Eversource Energy | 0.09 | -6.10 | 5.60 | -3.81 | 2.0452 | -0.0652 | |||
| PLD / Prologis, Inc. | 0.05 | 4.85 | 5.32 | -1.41 | 1.9413 | -0.0129 | |||
| SBAC / SBA Communications Corporation | 0.02 | -14.46 | 5.24 | -8.69 | 1.9120 | -0.1663 | |||
| XOM / Exxon Mobil Corporation | 0.05 | -7.06 | 5.14 | -15.75 | 1.8758 | -0.3342 | |||
| MS / Morgan Stanley | 0.03 | -1.00 | 4.61 | 19.54 | 1.6848 | 0.2858 | |||
| WFC / Wells Fargo & Company | 0.06 | 55.43 | 4.48 | 73.45 | 1.6345 | 0.6993 | |||
| XYL / Xylem Inc. | 0.03 | -1.00 | 4.30 | 7.22 | 1.5719 | 0.1166 | |||
| DIS / The Walt Disney Company | 0.03 | 5.17 | 4.28 | 32.11 | 1.5645 | 0.3894 | |||
| C / Citigroup Inc. | 0.05 | -1.00 | 4.28 | 18.72 | 1.5632 | 0.2562 | |||
| USB / U.S. Bancorp | 0.09 | -1.00 | 4.22 | 6.11 | 1.5420 | 0.0996 | |||
| EMR / Emerson Electric Co. | 0.03 | -6.09 | 4.16 | 14.21 | 1.5206 | 0.1991 | |||
| HON / Honeywell International Inc. | 0.02 | -12.88 | 4.16 | -4.19 | 1.5195 | -0.0546 | |||
| INTU / Intuit Inc. | 0.01 | -15.47 | 4.14 | 8.41 | 1.5116 | 0.1280 | |||
| MSFT / Microsoft Corporation | 0.01 | -0.99 | 4.07 | 31.19 | 1.4856 | 0.3617 | |||
| GOOGL / Alphabet Inc. | 0.02 | 116.04 | 4.06 | 218.18 | 1.4828 | 1.0290 | |||
| REXR / Rexford Industrial Realty, Inc. | 0.11 | 16.56 | 3.98 | 5.90 | 1.4548 | 0.0914 | |||
| TMO / Thermo Fisher Scientific Inc. | 0.01 | 30.21 | 3.98 | 6.10 | 1.4547 | 0.0939 | |||
| ARE / Alexandria Real Estate Equities, Inc. | 0.05 | 32.47 | 3.96 | 4.02 | 1.4470 | 0.0661 | |||
| AWK / American Water Works Company, Inc. | 0.03 | -4.77 | 3.91 | -10.21 | 1.4298 | -0.1504 | |||
| PFE / Pfizer Inc. | 0.16 | -1.00 | 3.91 | -5.31 | 1.4274 | -0.0686 | |||
| CVX / Chevron Corporation | 0.03 | -1.00 | 3.89 | -15.26 | 1.4194 | -0.2431 | |||
| ABBV / AbbVie Inc. | 0.02 | -1.00 | 3.83 | -12.29 | 1.3971 | -0.1839 | |||
| MDT / Medtronic plc | 0.04 | -1.00 | 3.82 | -3.98 | 1.3935 | -0.0466 | |||
| GE / General Electric Company | 0.01 | -1.00 | 3.57 | 27.33 | 1.3037 | 0.2874 | |||
| OVV / Ovintiv Inc. | 0.09 | -1.00 | 3.51 | -11.98 | 1.2830 | -0.1638 | |||
| LYB / LyondellBasell Industries N.V. | 0.06 | 9.13 | 3.45 | -10.31 | 1.2588 | -0.1342 | |||
| BALL / Ball Corporation | 0.06 | -1.00 | 3.42 | 6.64 | 1.2499 | 0.0866 | |||
| A / Agilent Technologies, Inc. | 0.03 | 12.53 | 3.24 | 13.52 | 1.1842 | 0.1488 | |||
| AMD / Advanced Micro Devices, Inc. | 0.02 | 98.70 | 3.22 | 174.57 | 1.1756 | 0.7504 | |||
| MRVL / Marvell Technology, Inc. | 0.04 | 117.60 | 3.22 | 173.55 | 1.1749 | 0.7486 | |||
| TXN / Texas Instruments Incorporated | 0.02 | -1.00 | 3.19 | 14.37 | 1.1660 | 0.1543 | |||
| BLK / BlackRock, Inc. | 0.00 | -0.98 | 2.98 | 9.78 | 1.0867 | 0.1042 | |||
| TRU / TransUnion | 0.03 | -1.00 | 2.96 | 4.97 | 1.0793 | 0.0589 | |||
| VEEV / Veeva Systems Inc. | 0.01 | -9.38 | 2.95 | 12.66 | 1.0789 | 0.1284 | |||
| ABT / Abbott Laboratories | 0.02 | -1.00 | 2.84 | 1.54 | 1.0366 | 0.0231 | |||
| UNH / UnitedHealth Group Incorporated | 0.01 | -23.09 | 2.82 | -54.20 | 1.0309 | -1.2026 | |||
| CFG / Citizens Financial Group, Inc. | 0.06 | -1.00 | 2.81 | 8.13 | 1.0253 | 0.0842 | |||
| OSK / Oshkosh Corporation | 0.02 | 2.80 | 1.0209 | 1.0209 | |||||
| SCHW / The Charles Schwab Corporation | 0.03 | -16.21 | 2.78 | -2.36 | 1.0140 | -0.0165 | |||
| TFC / Truist Financial Corporation | 0.06 | -1.00 | 2.75 | 3.42 | 1.0044 | 0.0406 | |||
| GM / General Motors Company | 0.06 | -1.00 | 2.73 | 3.57 | 0.9965 | 0.0417 | |||
| RBA / RB Global, Inc. | 0.03 | -19.01 | 2.70 | -14.26 | 0.9859 | -0.1553 | |||
| HCA / HCA Healthcare, Inc. | 0.01 | -19.90 | 2.68 | -11.19 | 0.9795 | -0.1152 | |||
| EOG / EOG Resources, Inc. | 0.02 | -7.13 | 2.60 | -13.38 | 0.9507 | -0.1386 | |||
| HD / The Home Depot, Inc. | 0.01 | -0.99 | 2.56 | -0.93 | 0.9354 | -0.0019 | |||
| IEX / IDEX Corporation | 0.01 | -1.00 | 2.56 | -3.98 | 0.9342 | -0.0312 | |||
| JNJ / Johnson & Johnson | 0.02 | -1.00 | 2.50 | -8.79 | 0.9138 | -0.0808 | |||
| INVH / Invitation Homes Inc. | 0.07 | -1.00 | 2.42 | -6.83 | 0.8825 | -0.0575 | |||
| AES / The AES Corporation | 0.23 | 92.00 | 2.40 | 62.62 | 0.8755 | 0.3412 | |||
| EQIX / Equinix, Inc. | 0.00 | -0.99 | 2.38 | -3.42 | 0.8675 | -0.0239 | |||
| PG / The Procter & Gamble Company | 0.01 | -8.96 | 2.31 | -14.87 | 0.8426 | -0.1400 | |||
| JD / JD.com, Inc. - Depositary Receipt (Common Stock) | 0.07 | -1.00 | 2.30 | -21.43 | 0.8414 | -0.2213 | |||
| G / Genpact Limited | 0.05 | -24.82 | 2.29 | -34.33 | 0.8365 | -0.4276 | |||
| TSN / Tyson Foods, Inc. | 0.04 | -11.89 | 2.21 | -22.77 | 0.8080 | -0.2302 | |||
| GMED / Globus Medical, Inc. | 0.04 | -1.00 | 2.13 | -20.20 | 0.7767 | -0.1891 | |||
| KLAC / KLA Corporation | 0.00 | -0.96 | 1.85 | 30.57 | 0.6739 | 0.1614 | |||
| MU / Micron Technology, Inc. | 0.01 | -1.00 | 1.83 | 40.45 | 0.6683 | 0.1960 | |||
| ETN / Eaton Corporation plc | 0.00 | 1.72 | 0.6291 | 0.6291 | |||||
| GPN / Global Payments Inc. | 0.02 | -1.00 | 1.68 | -19.05 | 0.6147 | -0.1392 | |||
| META / Meta Platforms, Inc. | 0.00 | -0.97 | 1.66 | 26.88 | 0.6052 | 0.1315 | |||
| PSX / Phillips 66 | 0.01 | -0.99 | 1.63 | -4.35 | 0.5947 | -0.0224 | |||
| CSX / CSX Corporation | 0.05 | -1.00 | 1.54 | 9.76 | 0.5631 | 0.0539 | |||
| SBUX / Starbucks Corporation | 0.02 | -1.00 | 1.54 | -7.52 | 0.5619 | -0.0411 | |||
| GS / The Goldman Sachs Group, Inc. | 0.00 | -16.62 | 1.53 | 8.05 | 0.5588 | 0.0454 | |||
| AXP / American Express Company | 0.00 | 1.50 | 0.5468 | 0.5468 | |||||
| LUV / Southwest Airlines Co. | 0.05 | 1.49 | 0.5433 | 0.5433 | |||||
| FCX / Freeport-McMoRan Inc. | 0.03 | 1.46 | 0.5348 | 0.5348 | |||||
| RTX / RTX Corporation | 0.01 | -53.02 | 1.40 | -48.21 | 0.5129 | -0.4700 | |||
| PAAS / Pan American Silver Corp. | 0.05 | -55.81 | 1.40 | -51.41 | 0.5113 | -0.5331 | |||
| MONOY / MonotaRO Co., Ltd. - Depositary Receipt (Common Stock) | 0.07 | -58.51 | 1.40 | -56.17 | 0.5112 | -0.6459 | |||
| ADSK / Autodesk, Inc. | 0.00 | -13.94 | 1.39 | 1.76 | 0.5075 | 0.0125 | |||
| RMD / ResMed Inc. | 0.01 | 1.37 | 0.4987 | 0.4987 | |||||
| AME / AMETEK, Inc. | 0.01 | -1.00 | 1.36 | 4.06 | 0.4968 | 0.0230 | |||
| ZTS / Zoetis Inc. | 0.01 | -1.00 | 1.35 | -6.19 | 0.4928 | -0.0288 | |||
| UNP / Union Pacific Corporation | 0.01 | -1.00 | 1.35 | -3.58 | 0.4914 | -0.0144 | |||
| SEE / Sealed Air Corporation | 0.04 | -1.00 | 1.34 | 6.35 | 0.4895 | 0.0325 | |||
| MSCI / MSCI Inc. | 0.00 | -49.19 | 1.32 | -48.20 | 0.4830 | -0.4421 | |||
| COO / The Cooper Companies, Inc. | 0.02 | 1.32 | 0.4823 | 0.4823 | |||||
| AON / Aon plc | 0.00 | -10.60 | 1.29 | -20.07 | 0.4713 | -0.1140 | |||
| MKC / McCormick & Company, Incorporated | 0.02 | -48.81 | 1.29 | -52.88 | 0.4700 | -0.5193 | |||
| OKE / ONEOK, Inc. | 0.02 | -1.00 | 1.28 | -18.59 | 0.4689 | -0.1025 | |||
| CCI / Crown Castle Inc. | 0.01 | -0.99 | 1.28 | -2.36 | 0.4675 | -0.0080 | |||
| CZR / Caesars Entertainment, Inc. | 0.04 | 1.27 | 0.4625 | 0.4625 | |||||
| CHRW / C.H. Robinson Worldwide, Inc. | 0.01 | -1.00 | 1.26 | -7.27 | 0.4616 | -0.0323 | |||
| KDP / Keurig Dr Pepper Inc. | 0.04 | -1.00 | 1.24 | -4.38 | 0.4542 | -0.0171 | |||
| COP / ConocoPhillips | 0.01 | -1.00 | 1.24 | -15.36 | 0.4529 | -0.0784 | |||
| UPS / United Parcel Service, Inc. | 0.01 | -1.00 | 1.23 | -9.10 | 0.4486 | -0.0415 | |||
| CRM / Salesforce, Inc. | 0.00 | -0.98 | 1.21 | 0.67 | 0.4412 | 0.0060 | |||
| ACN / Accenture plc | 0.00 | -0.98 | 1.20 | -5.20 | 0.4399 | -0.0204 | |||
| DD / DuPont de Nemours, Inc. | 0.02 | -1.00 | 1.20 | -9.11 | 0.4375 | -0.0400 | |||
| MCD / McDonald's Corporation | 0.00 | 1.16 | 0.4233 | 0.4233 | |||||
| BMY / Bristol-Myers Squibb Company | 0.02 | -51.07 | 1.12 | -62.86 | 0.4098 | -0.6853 | |||
| SLB / Schlumberger Limited | 0.03 | -1.00 | 0.97 | -19.95 | 0.3549 | -0.0851 | |||
| ADBE / Adobe Inc. | 0.00 | -0.97 | 0.91 | -0.11 | 0.3329 | 0.0022 |