Basic Stats
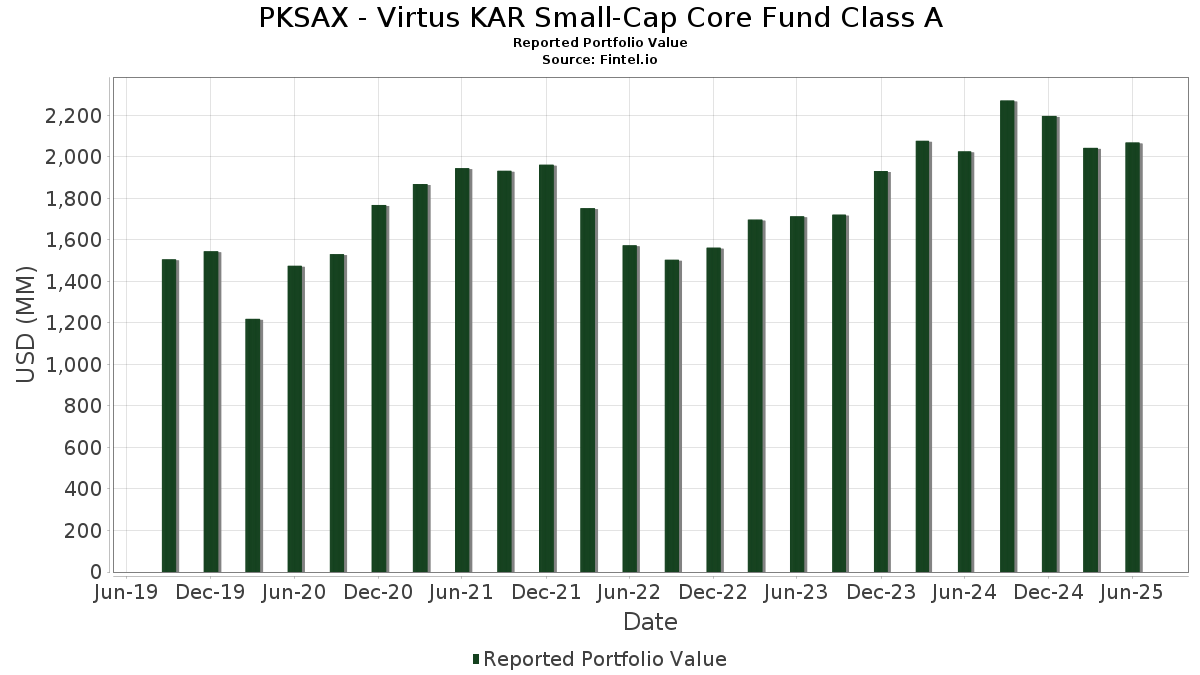
| Portfolio Value | $ 2,069,504,345 |
| Current Positions | 27 |
Latest Holdings, Performance, AUM (from 13F, 13D)
PKSAX - Virtus KAR Small-Cap Core Fund Class A has disclosed 27 total holdings in their latest SEC filings. Most recent portfolio value is calculated to be $ 2,069,504,345 USD. Actual Assets Under Management (AUM) is this value plus cash (which is not disclosed). PKSAX - Virtus KAR Small-Cap Core Fund Class A’s top holdings are Primerica, Inc. (US:PRI) , Simpson Manufacturing Co., Inc. (US:SSD) , CorVel Corporation (US:CRVL) , EMCOR Group, Inc. (US:EME) , and Watts Water Technologies, Inc. (US:WTS) .
Top Increases This Quarter
We use the change in the portfolio allocation because this is the most meaningful metric. Changes can be due to trades or changes in share prices.
| Security | Shares (MM) |
Value (MM$) |
Portfolio % | ΔPortfolio % |
|---|---|---|---|---|
| 0.56 | 69.33 | 3.2617 | 1.1058 | |
| 0.20 | 107.87 | 5.0751 | 0.8195 | |
| 0.44 | 107.82 | 5.0728 | 0.7499 | |
| 8.93 | 96.62 | 4.5456 | 0.4797 | |
| 97.77 | 97.77 | 4.5998 | 0.3887 | |
| 0.24 | 47.07 | 2.2147 | 0.2474 | |
| 1.29 | 94.26 | 4.4346 | 0.1960 | |
| 1.22 | 54.10 | 2.5452 | 0.1576 | |
| 2.70 | 67.49 | 3.1750 | 0.1564 | |
| 1.22 | 76.27 | 3.5885 | 0.1096 |
Top Decreases This Quarter
We use the change in the portfolio allocation because this is the most meaningful metric. Changes can be due to trades or changes in share prices.
| Security | Shares (MM) |
Value (MM$) |
Portfolio % | ΔPortfolio % |
|---|---|---|---|---|
| 1.07 | 109.46 | 5.1500 | -0.8044 | |
| 1.88 | 41.26 | 1.9413 | -0.5339 | |
| 0.57 | 78.90 | 3.7119 | -0.4538 | |
| 0.70 | 69.43 | 3.2664 | -0.4283 | |
| 0.24 | 75.77 | 3.5649 | -0.3828 | |
| 0.49 | 135.27 | 6.3641 | -0.3432 | |
| 0.83 | 60.08 | 2.8264 | -0.3365 | |
| 1.40 | 98.78 | 4.6474 | -0.2017 | |
| 0.85 | 72.65 | 3.4182 | -0.1867 | |
| 0.44 | 17.93 | 0.8438 | -0.1729 |
13F and Fund Filings
This form was filed on 2025-08-25 for the reporting period 2025-06-30. Click the link icon to see the full transaction history.
Upgrade to unlock premium data and export to Excel ![]() .
.
| Security | Type | Avg Share Price | Shares (MM) |
ΔShares (%) |
ΔShares (%) |
Value ($MM) |
Portfolio (%) |
ΔPortfolio (%) |
|
|---|---|---|---|---|---|---|---|---|---|
| PRI / Primerica, Inc. | 0.49 | 0.00 | 135.27 | -3.82 | 6.3641 | -0.3432 | |||
| SSD / Simpson Manufacturing Co., Inc. | 0.82 | 0.00 | 126.97 | -1.13 | 5.9734 | -0.1509 | |||
| CRVL / CorVel Corporation | 1.07 | -4.48 | 109.46 | -12.32 | 5.1500 | -0.8044 | |||
| EME / EMCOR Group, Inc. | 0.20 | -16.46 | 107.87 | 20.89 | 5.0751 | 0.8195 | |||
| WTS / Watts Water Technologies, Inc. | 0.44 | -1.35 | 107.82 | 18.95 | 5.0728 | 0.7499 | |||
| TTC / The Toro Company | 1.40 | 0.00 | 98.78 | -2.85 | 4.6474 | -0.2017 | |||
| FCN / FTI Consulting, Inc. | 0.61 | 0.00 | 98.40 | -1.57 | 4.6295 | -0.1384 | |||
| DGCXX / Dreyfus Government Cash Management Funds - Dreyfus Government Cash Management Fund Institutional Shares | 97.77 | 10.73 | 97.77 | 10.73 | 4.5998 | 0.3887 | |||
| RMV N / Rightmove plc | 8.93 | -6.79 | 96.62 | 13.33 | 4.5456 | 0.4797 | |||
| GOLF / Acushnet Holdings Corp. | 1.29 | 0.00 | 94.26 | 6.06 | 4.4346 | 0.1960 | |||
| LSTR / Landstar System, Inc. | 0.57 | -2.41 | 78.90 | -9.67 | 3.7119 | -0.4538 | |||
| RBC / RBC Bearings Incorporated | 0.20 | -18.46 | 76.69 | -2.49 | 3.6081 | -0.1429 | |||
| MC / Moelis & Company | 1.22 | -2.08 | 76.27 | 4.56 | 3.5885 | 0.1096 | |||
| KAI / Kadant Inc. | 0.24 | -2.85 | 75.77 | -8.46 | 3.5649 | -0.3828 | |||
| GGG / Graco Inc. | 0.85 | -6.63 | 72.65 | -3.88 | 3.4182 | -0.1867 | |||
| UFPI / UFP Industries, Inc. | 0.70 | -3.45 | 69.43 | -10.38 | 3.2664 | -0.4283 | |||
| BANF / BancFirst Corporation | 0.56 | 36.31 | 69.33 | 53.37 | 3.2617 | 1.1058 | |||
| FHB / First Hawaiian, Inc. | 2.70 | 4.40 | 67.49 | 6.62 | 3.1750 | 0.1564 | |||
| RLI / RLI Corp. | 0.83 | 0.76 | 60.08 | -9.41 | 2.8264 | -0.3365 | |||
| FDS / FactSet Research Systems Inc. | 0.13 | 0.00 | 56.20 | -1.62 | 2.6439 | -0.0803 | |||
| JKHY / Jack Henry & Associates, Inc. | 0.31 | -2.52 | 55.71 | -3.82 | 2.6211 | -0.1414 | |||
| APAM / Artisan Partners Asset Management Inc. | 1.22 | -4.69 | 54.10 | 8.06 | 2.5452 | 0.1576 | |||
| MANH / Manhattan Associates, Inc. | 0.24 | 0.00 | 47.07 | 14.12 | 2.2147 | 0.2474 | |||
| DCI / Donaldson Company, Inc. | 0.64 | 0.00 | 44.20 | 3.42 | 2.0795 | 0.0411 | |||
| CWAN / Clearwater Analytics Holdings, Inc. | 1.88 | -2.84 | 41.26 | -20.50 | 1.9413 | -0.5339 | |||
| LCII / LCI Industries | 0.36 | -6.43 | 33.19 | -2.41 | 1.5617 | -0.0604 | |||
| KFRC / Kforce Inc. | 0.44 | 0.00 | 17.93 | -15.87 | 0.8438 | -0.1729 |