Basic Stats
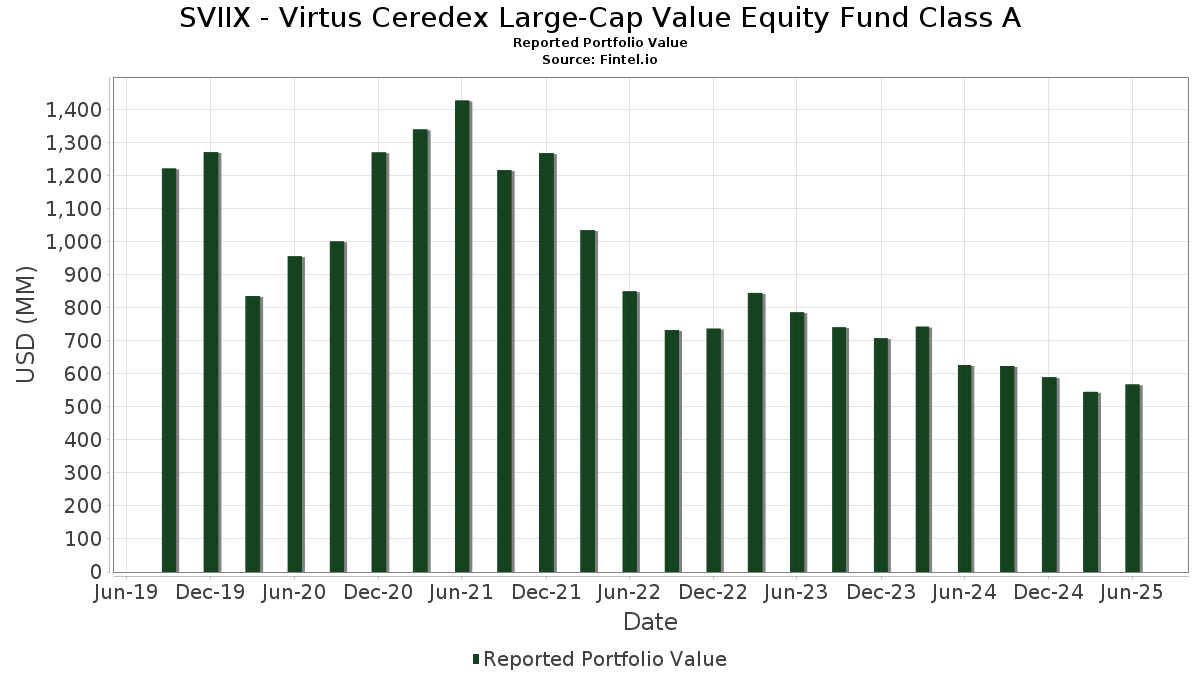
| Portfolio Value | $ 567,507,532 |
| Current Positions | 50 |
Latest Holdings, Performance, AUM (from 13F, 13D)
SVIIX - Virtus Ceredex Large-Cap Value Equity Fund Class A has disclosed 50 total holdings in their latest SEC filings. Most recent portfolio value is calculated to be $ 567,507,532 USD. Actual Assets Under Management (AUM) is this value plus cash (which is not disclosed). SVIIX - Virtus Ceredex Large-Cap Value Equity Fund Class A’s top holdings are JPMorgan Chase & Co. (US:JPM) , Bank of America Corporation (US:BAC) , Rockwell Automation, Inc. (US:ROK) , Exxon Mobil Corporation (KZ:XOM_KZ) , and Starbucks Corporation (US:SBUX) . SVIIX - Virtus Ceredex Large-Cap Value Equity Fund Class A’s new positions include Exxon Mobil Corporation (KZ:XOM_KZ) , Dell Technologies Inc. (US:DELL) , Meta Platforms, Inc. (US:META) , Royal Caribbean Cruises Ltd. (US:RCL) , and Alcon Inc. (CH:ALC) .
Top Increases This Quarter
We use the change in the portfolio allocation because this is the most meaningful metric. Changes can be due to trades or changes in share prices.
| Security | Shares (MM) |
Value (MM$) |
Portfolio % | ΔPortfolio % |
|---|---|---|---|---|
| 0.13 | 13.89 | 2.3550 | 2.3550 | |
| 0.10 | 12.46 | 2.1121 | 2.1121 | |
| 0.02 | 12.17 | 2.0629 | 2.0629 | |
| 0.07 | 10.06 | 1.7061 | 1.7061 | |
| 0.03 | 8.70 | 1.4757 | 1.4757 | |
| 0.10 | 8.54 | 1.4473 | 1.4473 | |
| 0.02 | 7.62 | 1.2912 | 1.2912 | |
| 0.14 | 13.38 | 2.2681 | 1.2111 | |
| 0.10 | 11.91 | 2.0201 | 0.9204 | |
| 0.04 | 14.65 | 2.4844 | 0.6151 |
Top Decreases This Quarter
We use the change in the portfolio allocation because this is the most meaningful metric. Changes can be due to trades or changes in share prices.
| Security | Shares (MM) |
Value (MM$) |
Portfolio % | ΔPortfolio % |
|---|---|---|---|---|
| 0.08 | 8.43 | 1.4293 | -1.3413 | |
| 0.00 | 0.00 | -1.0106 | ||
| 0.13 | 5.88 | 0.9962 | -0.8598 | |
| 0.10 | 9.54 | 1.6168 | -0.7031 | |
| 0.06 | 9.77 | 1.6569 | -0.6291 | |
| 0.36 | 12.33 | 2.0914 | -0.5919 | |
| 0.01 | 5.93 | 1.0051 | -0.5294 | |
| 0.05 | 10.73 | 1.8186 | -0.4714 | |
| 0.17 | 11.16 | 1.8927 | -0.4451 | |
| 0.39 | 13.22 | 2.2417 | -0.3899 |
13F and Fund Filings
This form was filed on 2025-08-26 for the reporting period 2025-06-30. Click the link icon to see the full transaction history.
Upgrade to unlock premium data and export to Excel ![]() .
.
| Security | Type | Avg Share Price | Shares (MM) |
ΔShares (%) |
ΔShares (%) |
Value ($MM) |
Portfolio (%) |
ΔPortfolio (%) |
|
|---|---|---|---|---|---|---|---|---|---|
| JPM / JPMorgan Chase & Co. | 0.06 | 1.76 | 18.49 | 20.26 | 3.1358 | 0.3831 | |||
| BAC / Bank of America Corporation | 0.32 | -12.67 | 15.24 | -0.97 | 2.5838 | -0.1708 | |||
| ROK / Rockwell Automation, Inc. | 0.04 | 9.14 | 14.65 | 40.32 | 2.4844 | 0.6151 | |||
| XOM_KZ / Exxon Mobil Corporation | 0.13 | 13.89 | 2.3550 | 2.3550 | |||||
| SBUX / Starbucks Corporation | 0.15 | 35.22 | 13.83 | 26.32 | 2.3454 | 0.3852 | |||
| KEY / KeyCorp | 0.79 | 1.76 | 13.83 | 10.86 | 2.3446 | 0.1118 | |||
| ELS / Equity LifeStyle Properties, Inc. | 0.22 | 8.43 | 13.47 | 0.25 | 2.2840 | -0.1213 | |||
| DHR / Danaher Corporation | 0.07 | 6.59 | 13.41 | 2.71 | 2.2731 | -0.0633 | |||
| AON / Aon plc | 0.04 | 15.56 | 13.38 | 3.31 | 2.2683 | -0.0499 | |||
| AEE / Ameren Corporation | 0.14 | 136.82 | 13.38 | 126.54 | 2.2681 | 1.2111 | |||
| PPL / PPL Corporation | 0.39 | -44.93 | 13.22 | -31.13 | 2.2417 | -0.3899 | |||
| COF / Capital One Financial Corporation | 0.06 | 15.95 | 13.10 | 37.59 | 2.2216 | 0.5169 | |||
| HD / The Home Depot, Inc. | 0.04 | -6.76 | 13.09 | -6.73 | 2.2199 | -0.2926 | |||
| MSFT / Microsoft Corporation | 0.03 | -10.62 | 13.09 | 18.44 | 2.2197 | 0.2410 | |||
| JNJ / Johnson & Johnson | 0.08 | 17.78 | 12.94 | 11.01 | 2.1945 | 0.3784 | |||
| NXPI / NXP Semiconductors N.V. | 0.06 | 1.76 | 12.82 | 16.98 | 2.1733 | 0.2119 | |||
| IP / International Paper Company | 0.27 | 27.98 | 12.51 | 12.34 | 2.1217 | 0.1278 | |||
| DELL / Dell Technologies Inc. | 0.10 | 12.46 | 2.1121 | 2.1121 | |||||
| FCX / Freeport-McMoRan Inc. | 0.29 | 11.41 | 12.43 | 2.72 | 2.1068 | 0.5134 | |||
| URI / United Rentals, Inc. | 0.02 | 4.95 | 12.39 | 26.16 | 2.1008 | 0.3428 | |||
| SLB / Schlumberger Limited | 0.36 | 1.76 | 12.33 | -17.72 | 2.0914 | -0.5919 | |||
| CHD / Church & Dwight Co., Inc. | 0.13 | 4.10 | 12.29 | -9.13 | 2.0838 | -0.3369 | |||
| MMM / 3M Company | 0.08 | -11.04 | 12.21 | -7.78 | 2.0709 | -0.2998 | |||
| META / Meta Platforms, Inc. | 0.02 | 12.17 | 2.0629 | 2.0629 | |||||
| RJF / Raymond James Financial, Inc. | 0.08 | 1.27 | 12.12 | 11.82 | 2.0555 | 0.1146 | |||
| DIS / The Walt Disney Company | 0.10 | 54.36 | 11.91 | 93.94 | 2.0201 | 0.9204 | |||
| TYIA / Johnson Controls International plc | 0.11 | -11.88 | 11.36 | 16.18 | 1.9261 | 0.1759 | |||
| MDLZ / Mondelez International, Inc. | 0.17 | -14.01 | 11.16 | -14.53 | 1.8927 | -0.4451 | |||
| J / Jacobs Solutions Inc. | 0.08 | -17.52 | 11.02 | -22.39 | 1.8681 | -0.3181 | |||
| NKE / NIKE, Inc. | 0.15 | 31.61 | 10.98 | 47.28 | 1.8623 | 0.5274 | |||
| FDX / FedEx Corporation | 0.05 | 1.76 | 10.90 | -5.12 | 1.8483 | -0.2082 | |||
| AMT / American Tower Corporation | 0.05 | -17.46 | 10.73 | -16.16 | 1.8186 | -0.4714 | |||
| IR / Ingersoll Rand Inc. | 0.12 | -60.71 | 10.39 | -35.09 | 1.7615 | 0.2228 | |||
| FANG / Diamondback Energy, Inc. | 0.07 | 10.06 | 1.7061 | 1.7061 | |||||
| LRCX / Lam Research Corporation | 0.10 | -19.64 | 10.01 | 7.60 | 1.6978 | 0.0319 | |||
| PKI / Revvity Inc. | 0.10 | 1.76 | 9.90 | -6.97 | 1.6779 | -0.2263 | |||
| MU / Micron Technology, Inc. | 0.08 | -10.29 | 9.82 | 27.25 | 1.6658 | 0.2838 | |||
| BDX / Becton, Dickinson and Company | 0.06 | 1.76 | 9.77 | -23.48 | 1.6569 | -0.6291 | |||
| SO / The Southern Company | 0.10 | -26.33 | 9.54 | -26.42 | 1.6168 | -0.7031 | |||
| LEN / Lennar Corporation | 0.08 | -0.66 | 9.38 | -4.27 | 1.5903 | -0.1635 | |||
| DOW / Dow Inc. | 0.34 | 24.03 | 8.97 | -5.94 | 1.5212 | -0.1863 | |||
| RCL / Royal Caribbean Cruises Ltd. | 0.03 | 8.70 | 1.4757 | 1.4757 | |||||
| OWL / Blue Owl Capital Inc. | 0.45 | 1.76 | 8.69 | -2.45 | 1.4731 | -0.1212 | |||
| ALC / Alcon Inc. | 0.10 | 8.54 | 1.4473 | 1.4473 | |||||
| BAH / Booz Allen Hamilton Holding Corporation | 0.08 | -80.32 | 8.43 | -75.84 | 1.4293 | -1.3413 | |||
| MCO / Moody's Corporation | 0.02 | 7.62 | 1.2912 | 1.2912 | |||||
| WMT / Walmart Inc. | 0.08 | 18.94 | 7.61 | 32.46 | 1.2904 | 0.2621 | |||
| DAL / Delta Air Lines, Inc. | 0.15 | -7.87 | 7.46 | 3.92 | 1.2641 | -0.0201 | |||
| GEV / GE Vernova Inc. | 0.01 | -60.10 | 5.93 | -30.84 | 1.0051 | -0.5294 | |||
| KNX / Knight-Swift Transportation Holdings Inc. | 0.13 | -37.05 | 5.88 | -47.51 | 0.9962 | -0.8598 | |||
| AME / AMETEK, Inc. | 0.00 | -100.00 | 0.00 | -100.00 | -1.0106 |