Basic Stats
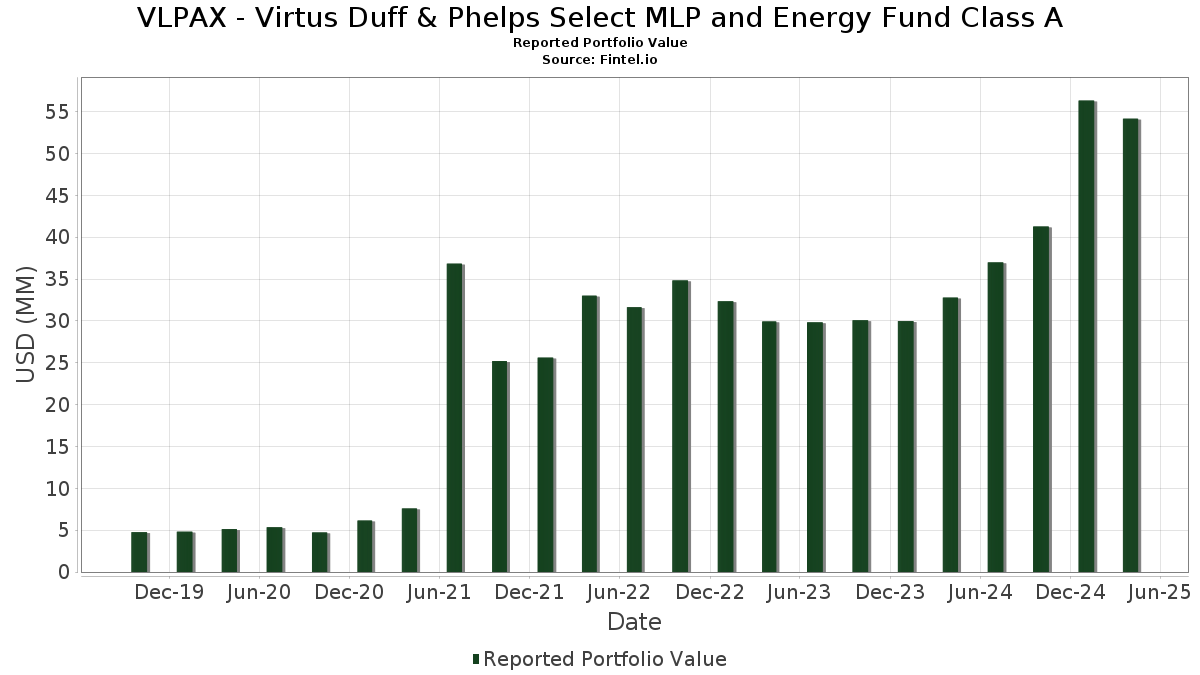
| Portfolio Value | $ 54,152,037 |
| Current Positions | 28 |
Latest Holdings, Performance, AUM (from 13F, 13D)
VLPAX - Virtus Duff & Phelps Select MLP and Energy Fund Class A has disclosed 28 total holdings in their latest SEC filings. Most recent portfolio value is calculated to be $ 54,152,037 USD. Actual Assets Under Management (AUM) is this value plus cash (which is not disclosed). VLPAX - Virtus Duff & Phelps Select MLP and Energy Fund Class A’s top holdings are Cheniere Energy, Inc. (US:LNG) , Targa Resources Corp. (US:TRGP) , TC Energy Corporation (US:TRP) , DT Midstream, Inc. (US:DTM) , and The Williams Companies, Inc. (US:WMB) . VLPAX - Virtus Duff & Phelps Select MLP and Energy Fund Class A’s new positions include The Southern Company (US:SO) , CMS Energy Corporation (US:CMS) , .
Top Increases This Quarter
We use the change in the portfolio allocation because this is the most meaningful metric. Changes can be due to trades or changes in share prices.
| Security | Shares (MM) |
Value (MM$) |
Portfolio % | ΔPortfolio % |
|---|---|---|---|---|
| 0.04 | 3.53 | 6.4472 | 1.9883 | |
| 0.02 | 5.67 | 10.3578 | 1.5835 | |
| 0.01 | 0.68 | 1.2339 | 1.2339 | |
| 0.01 | 0.67 | 1.2153 | 1.2153 | |
| 0.02 | 1.29 | 2.3639 | 1.1879 | |
| 0.04 | 1.38 | 2.5280 | 1.1754 | |
| 0.02 | 1.32 | 2.4111 | 1.1038 | |
| 0.07 | 3.58 | 6.5367 | 0.9543 | |
| 0.03 | 4.95 | 9.0299 | 0.9488 | |
| 0.05 | 2.28 | 4.1566 | 0.9399 |
Top Decreases This Quarter
We use the change in the portfolio allocation because this is the most meaningful metric. Changes can be due to trades or changes in share prices.
| Security | Shares (MM) |
Value (MM$) |
Portfolio % | ΔPortfolio % |
|---|---|---|---|---|
| 0.03 | 2.55 | 4.6617 | -2.5025 | |
| 0.00 | 0.00 | -1.3499 | ||
| 0.00 | 0.00 | -1.2393 | ||
| 0.08 | 1.51 | 2.7522 | -1.2381 | |
| 0.17 | 2.84 | 5.1879 | -0.3642 | |
| 0.02 | 0.63 | 1.1490 | -0.2951 | |
| 0.01 | 0.69 | 1.2592 | -0.2675 | |
| 0.02 | 1.02 | 1.8680 | -0.0974 |
13F and Fund Filings
This form was filed on 2025-06-25 for the reporting period 2025-04-30. Click the link icon to see the full transaction history.
Upgrade to unlock premium data and export to Excel ![]() .
.
| Security | Type | Avg Share Price | Shares (MM) |
ΔShares (%) |
ΔShares (%) |
Value ($MM) |
Portfolio (%) |
ΔPortfolio (%) |
|
|---|---|---|---|---|---|---|---|---|---|
| LNG / Cheniere Energy, Inc. | 0.02 | 9.17 | 5.67 | 12.81 | 10.3578 | 1.5835 | |||
| TRGP / Targa Resources Corp. | 0.03 | 22.96 | 4.95 | 6.78 | 9.0299 | 0.9488 | |||
| TRP / TC Energy Corporation | 0.07 | 0.00 | 3.58 | 11.88 | 6.5367 | 0.9543 | |||
| DTM / DT Midstream, Inc. | 0.04 | 43.69 | 3.53 | 38.16 | 6.4472 | 1.9883 | |||
| WMB / The Williams Companies, Inc. | 0.06 | 0.00 | 3.52 | 5.67 | 6.4343 | 0.6152 | |||
| ET / Energy Transfer LP - Limited Partnership | 0.17 | 10.57 | 2.84 | -10.69 | 5.1879 | -0.3642 | |||
| MPLX / MPLX LP - Limited Partnership | 0.05 | 0.00 | 2.67 | -2.09 | 4.8699 | 0.1174 | |||
| OKE / ONEOK, Inc. | 0.03 | -26.46 | 2.55 | -37.83 | 4.6617 | -2.5025 | |||
| KMI / Kinder Morgan, Inc. | 0.10 | 6.08 | 2.55 | 1.56 | 4.6511 | 0.2732 | |||
| PBA / Pembina Pipeline Corporation | 0.06 | 13.05 | 2.40 | 19.58 | 4.3841 | 0.8809 | |||
| ENB / Enbridge Inc. | 0.05 | 14.36 | 2.28 | 23.49 | 4.1566 | 0.9399 | |||
| EPD / Enterprise Products Partners L.P. - Limited Partnership | 0.06 | 16.80 | 1.90 | 6.99 | 3.4663 | 0.3694 | |||
| PAGP / Plains GP Holdings, L.P. - Limited Partnership | 0.08 | -25.21 | 1.51 | -34.08 | 2.7522 | -1.2381 | |||
| KGS / Kodiak Gas Services, Inc. | 0.04 | 67.44 | 1.40 | 21.76 | 2.5563 | 0.5496 | |||
| NI / NiSource Inc. | 0.04 | 70.34 | 1.38 | 78.58 | 2.5280 | 1.1754 | |||
| LNT / Alliant Energy Corporation | 0.02 | 70.01 | 1.32 | 76.23 | 2.4111 | 1.1038 | |||
| SUN / Sunoco LP - Limited Partnership | 0.02 | 86.08 | 1.29 | 92.27 | 2.3639 | 1.1879 | |||
| DGCXX / Dreyfus Government Cash Management Funds - Dreyfus Government Cash Management Fund Institutional Shares | 1.05 | 26.13 | 1.05 | 26.21 | 1.9087 | 0.4626 | |||
| GLNG / Golar LNG Limited | 0.02 | -12.92 | 1.02 | -9.15 | 1.8680 | -0.0974 | |||
| KEYRY / Keyera Corp. - Depositary Receipt (Common Stock) | 0.03 | 0.00 | 1.00 | 9.30 | 1.8257 | 0.2307 | |||
| ETR / Entergy Corporation | 0.01 | 21.46 | 0.85 | 24.56 | 1.5472 | 0.3605 | |||
| ALTM / Arcadium Lithium plc | 0.02 | 72.60 | 0.78 | 10.86 | 1.4176 | 0.1943 | |||
| OGE / OGE Energy Corp. | 0.02 | 0.00 | 0.76 | 7.55 | 1.3789 | 0.1527 | |||
| SOBO / South Bow Corporation | 0.03 | 26.39 | 0.70 | 30.48 | 1.2834 | 0.3440 | |||
| GTLS / Chart Industries, Inc. | 0.01 | 23.56 | 0.69 | -21.17 | 1.2592 | -0.2675 | |||
| SO / The Southern Company | 0.01 | 0.68 | 1.2339 | 1.2339 | |||||
| CMS / CMS Energy Corporation | 0.01 | 0.67 | 1.2153 | 1.2153 | |||||
| HESM / Hess Midstream LP | 0.02 | -17.13 | 0.63 | -23.94 | 1.1490 | -0.2951 | |||
| PPL / PPL Corporation | 0.00 | -100.00 | 0.00 | -100.00 | -1.3499 | ||||
| VG / Venture Global, Inc. | 0.00 | -100.00 | 0.00 | -100.00 | -1.2393 |