Basic Stats
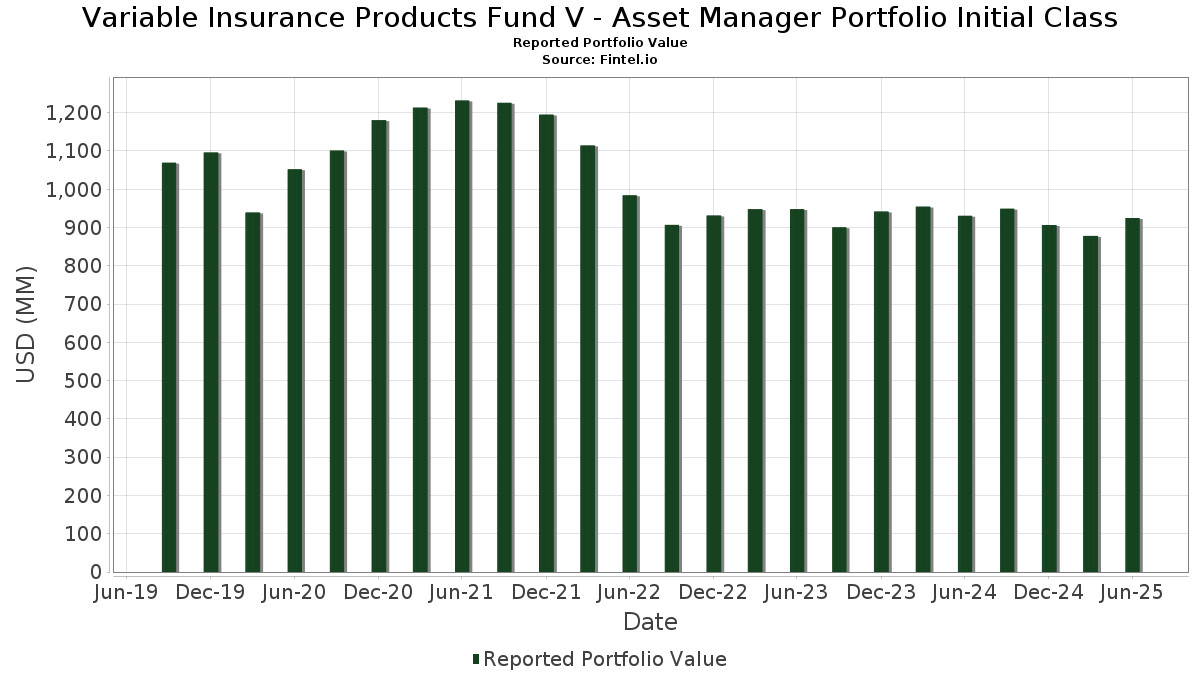
| Portfolio Value | $ 924,886,201 |
| Current Positions | 31 |
Latest Holdings, Performance, AUM (from 13F, 13D)
Variable Insurance Products Fund V - Asset Manager Portfolio Initial Class has disclosed 31 total holdings in their latest SEC filings. Most recent portfolio value is calculated to be $ 924,886,201 USD. Actual Assets Under Management (AUM) is this value plus cash (which is not disclosed). Variable Insurance Products Fund V - Asset Manager Portfolio Initial Class’s top holdings are VIP Investment Grade Central Fund (US:US3161672049) , Fidelity U.S. Equity Central Fund (US:31606V666) , Fidelity International Equity Central Fund (US:US31606V7165) , Fidelity Emerging Markets Equity Central Fund (US:US31606V6829) , and Fidelity Cash Central Fund (US:US31635A1051) .
Top Increases This Quarter
We use the change in the portfolio allocation because this is the most meaningful metric. Changes can be due to trades or changes in share prices.
| Security | Shares (MM) |
Value (MM$) |
Portfolio % | ΔPortfolio % |
|---|---|---|---|---|
| 0.16 | 17.88 | 1.9491 | 1.1873 | |
| 1.20 | 145.61 | 15.8753 | 0.8870 | |
| 9.07 | 9.07 | 0.9893 | 0.8261 | |
| 1.68 | 240.90 | 26.2637 | 0.7023 | |
| 0.41 | 19.98 | 2.1786 | 0.3201 | |
| 0.41 | 11.78 | 1.2847 | 0.3026 | |
| 0.25 | 62.58 | 6.8227 | 0.2960 | |
| 0.24 | 22.15 | 2.4148 | 0.2623 | |
| 0.10 | 9.64 | 1.0505 | 0.2195 | |
| 0.13 | 11.41 | 1.2437 | 0.1959 |
Top Decreases This Quarter
We use the change in the portfolio allocation because this is the most meaningful metric. Changes can be due to trades or changes in share prices.
| Security | Shares (MM) |
Value (MM$) |
Portfolio % | ΔPortfolio % |
|---|---|---|---|---|
| 32.60 | 32.61 | 3.5553 | -3.3264 | |
| 3.00 | 280.54 | 30.5856 | -0.8519 | |
| 0.01 | 1.90 | 0.2071 | -0.2855 | |
| -1.12 | -0.1217 | -0.1217 | ||
| 0.22 | 7.58 | 0.8261 | -0.1184 | |
| 0.07 | 6.74 | 0.7351 | -0.0345 | |
| 0.13 | 4.28 | 0.4665 | -0.0277 | |
| 0.03 | 2.24 | 0.2440 | -0.0119 | |
| 0.33 | 8.92 | 0.9726 | -0.0088 |
13F and Fund Filings
This form was filed on 2025-08-22 for the reporting period 2025-06-30. Click the link icon to see the full transaction history.
Upgrade to unlock premium data and export to Excel ![]() .
.
| Security | Type | Avg Share Price | Shares (MM) |
ΔShares (%) |
ΔShares (%) |
Value ($MM) |
Portfolio (%) |
ΔPortfolio (%) |
|
|---|---|---|---|---|---|---|---|---|---|
| US3161672049 / VIP Investment Grade Central Fund | 3.00 | 1.29 | 280.54 | 1.56 | 30.5856 | -0.8519 | |||
| 31606V666 / Fidelity U.S. Equity Central Fund | 1.68 | -4.16 | 240.90 | 7.26 | 26.2637 | 0.7023 | |||
| US31606V7165 / Fidelity International Equity Central Fund | 1.20 | -1.38 | 145.61 | 10.57 | 15.8753 | 0.8870 | |||
| US31606V6829 / Fidelity Emerging Markets Equity Central Fund | 0.25 | -1.90 | 62.58 | 9.13 | 6.8227 | 0.2960 | |||
| US31635A1051 / Fidelity Cash Central Fund | 32.60 | -46.07 | 32.61 | -46.07 | 3.5553 | -3.3264 | |||
| .IPBIC / Fidelity Inflation-Protected Bond Index Central Fund | 0.24 | 16.34 | 22.15 | 17.11 | 2.4148 | 0.2623 | |||
| FESM / Fidelity Covington Trust - Fidelity Enhanced Small Cap ETF | 0.66 | -2.27 | 20.97 | 6.05 | 2.2858 | 0.0357 | |||
| FBCG / Fidelity Covington Trust - Fidelity Blue Chip Growth ETF | 0.41 | 1.39 | 19.98 | 22.37 | 2.1786 | 0.3201 | |||
| US31606V6902 / Fidelity High Income Central Fund | 0.16 | 160.05 | 17.88 | 167.10 | 1.9491 | 1.1873 | |||
| FHEQ / Fidelity Greenwood Street Trust - Fidelity Hedged Equity Fund | 0.41 | 24.98 | 11.78 | 36.56 | 1.2847 | 0.3026 | |||
| TLT / iShares Trust - iShares 20+ Year Treasury Bond ETF | 0.13 | 27.81 | 11.41 | 23.91 | 1.2437 | 0.1959 | |||
| 315808709 / Fidelity Emerging Markets Debt Local Currency Central Fund | 0.10 | 22.62 | 9.64 | 31.97 | 1.0505 | 0.2195 | |||
| US31635A3032 / Fidelity Securities Lending Cash Central Fund | 9.07 | 514.81 | 9.07 | 515.12 | 0.9893 | 0.8261 | |||
| FFSM / Fidelity Covington Trust - Fidelity Fundamental Small-Mid Cap ETF | 0.33 | -3.97 | 8.92 | 3.46 | 0.9726 | -0.0088 | |||
| FMDE / Fidelity Covington Trust - Fidelity Enhanced Mid Cap ETF | 0.22 | -16.85 | 7.58 | -8.69 | 0.8261 | -0.1184 | |||
| US31606V7082 / Fidelity Floating Rate Central Fund | 0.07 | -0.34 | 6.74 | -0.30 | 0.7351 | -0.0345 | |||
| US3161673039 / Fidelity Commodity Strategy Central Fund | 0.07 | 37.82 | 6.18 | 33.44 | 0.6735 | 0.1467 | |||
| FELV / Fidelity Covington Trust - Enhanced Large Cap Value ETF | 0.13 | -4.65 | 4.28 | -1.45 | 0.4665 | -0.0277 | |||
| 31607D202 / Fidelity International Credit Central Fund | 0.03 | -1.37 | 2.24 | -0.44 | 0.2440 | -0.0119 | |||
| .RLESTEQ / Fidelity Real Estate Equity Central Fund | 0.01 | -54.69 | 1.90 | -56.11 | 0.2071 | -0.2855 | |||
| UST BILLS 0% 07/10/2025 / DBT (US912797LW51) | 0.95 | 0.1035 | 0.1035 | ||||||
| UST BILLS 0% 07/03/2025 / DBT (US912797NX17) | 0.58 | 0.0632 | 0.0632 | ||||||
| UST BILLS 0% 07/17/2025 / DBT (US912797PE18) | 0.44 | 0.0479 | 0.0479 | ||||||
| UST BILLS 0% 07/24/2025 / DBT (US912797PF82) | 0.33 | 0.0359 | 0.0359 | ||||||
| US 10YR NOTE FUT (CBT)SEP25 TYU5 / DIR (N/A) | 0.19 | 0.0209 | 0.0209 | ||||||
| UST BILLS 0% 07/31/2025 / DBT (US912797PG65) | 0.17 | 0.0185 | 0.0185 | ||||||
| UST BILLS 0% 09/18/2025 / DBT (US912797PX98) | 0.14 | 0.0151 | 0.0151 | ||||||
| MSCI EAFE FUT SEP25 MFSU5 / DE (N/A) | 0.11 | 0.0120 | 0.0120 | ||||||
| MSCI EMGMKT FUT SEP25 MESU5 / DE (N/A) | 0.10 | 0.0109 | 0.0109 | ||||||
| UST BILLS 0% 09/25/2025 / DBT (US912797PY71) | 0.04 | 0.0043 | 0.0043 | ||||||
| S and P500 EMINI FUT SEP25 ESU5 / DE (N/A) | -1.12 | -0.1217 | -0.1217 |