Basic Stats
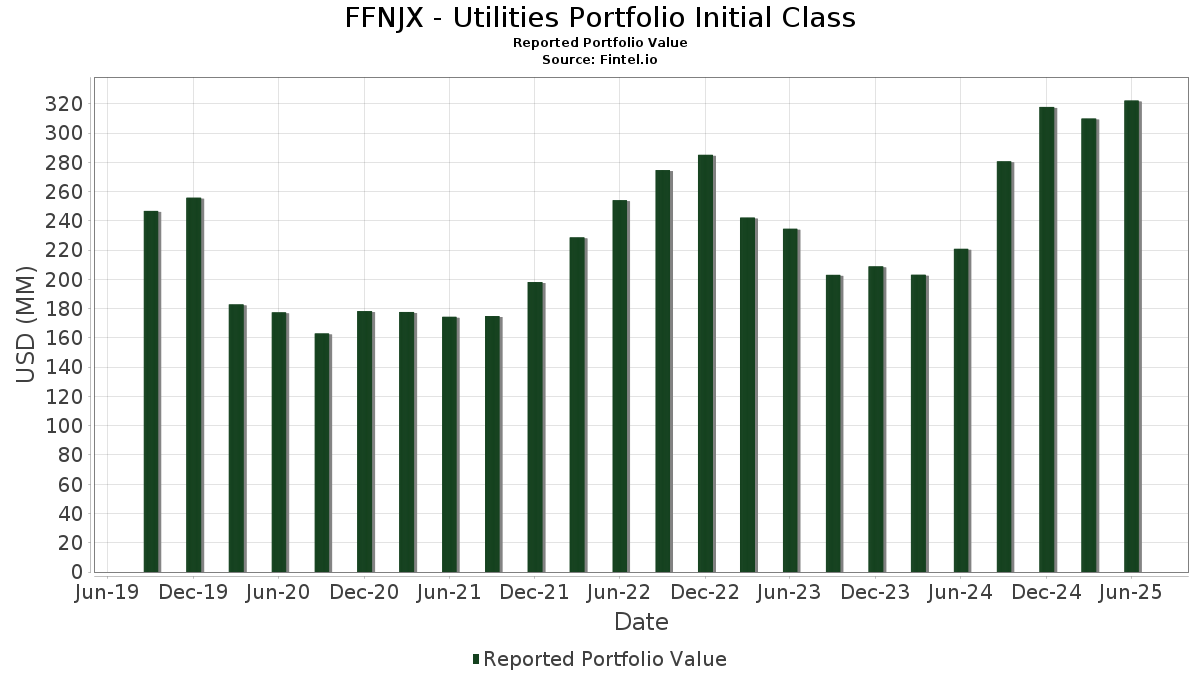
| Portfolio Value | $ 322,223,225 |
| Current Positions | 29 |
Latest Holdings, Performance, AUM (from 13F, 13D)
FFNJX - Utilities Portfolio Initial Class has disclosed 29 total holdings in their latest SEC filings. Most recent portfolio value is calculated to be $ 322,223,225 USD. Actual Assets Under Management (AUM) is this value plus cash (which is not disclosed). FFNJX - Utilities Portfolio Initial Class’s top holdings are NextEra Energy, Inc. (US:NEE) , Constellation Energy Corporation (US:CEG) , Vistra Corp. (US:VST) , Duke Energy Corporation (US:DUK) , and Sempra (US:SRE) . FFNJX - Utilities Portfolio Initial Class’s new positions include GFL Environmental Inc. (US:GFL) , .
Top Increases This Quarter
We use the change in the portfolio allocation because this is the most meaningful metric. Changes can be due to trades or changes in share prices.
| Security | Shares (MM) |
Value (MM$) |
Portfolio % | ΔPortfolio % |
|---|---|---|---|---|
| 0.14 | 27.35 | 8.5224 | 4.9669 | |
| 0.09 | 29.58 | 9.2155 | 4.8402 | |
| 0.12 | 8.66 | 2.6990 | 2.6990 | |
| 0.25 | 19.24 | 5.9961 | 2.0780 | |
| 0.55 | 37.91 | 11.8131 | 1.8131 | |
| 0.07 | 11.50 | 3.5841 | 1.7970 | |
| 0.01 | 5.02 | 1.5638 | 1.4084 | |
| 0.01 | 6.88 | 2.1433 | 0.8341 | |
| 0.04 | 2.04 | 0.6352 | 0.6352 | |
| 0.01 | 1.84 | 0.5722 | 0.3072 |
Top Decreases This Quarter
We use the change in the portfolio allocation because this is the most meaningful metric. Changes can be due to trades or changes in share prices.
| Security | Shares (MM) |
Value (MM$) |
Portfolio % | ΔPortfolio % |
|---|---|---|---|---|
| 0.27 | 0.27 | 0.0841 | -4.1399 | |
| 0.11 | 10.36 | 3.2270 | -2.0433 | |
| 0.05 | 0.52 | 0.1609 | -1.7501 | |
| 0.04 | 2.69 | 0.8366 | -1.7027 | |
| 0.06 | 6.41 | 1.9957 | -1.5781 | |
| 0.09 | 5.00 | 1.5579 | -1.5630 | |
| 0.22 | 26.34 | 8.2052 | -1.5473 | |
| 0.41 | 17.62 | 5.4898 | -0.9853 | |
| 0.33 | 11.99 | 3.7360 | -0.9540 | |
| 0.71 | 9.93 | 3.0926 | -0.9360 |
13F and Fund Filings
This form was filed on 2025-08-22 for the reporting period 2025-06-30. Click the link icon to see the full transaction history.
Upgrade to unlock premium data and export to Excel ![]() .
.
| Security | Type | Avg Share Price | Shares (MM) |
ΔShares (%) |
ΔShares (%) |
Value ($MM) |
Portfolio (%) |
ΔPortfolio (%) |
|
|---|---|---|---|---|---|---|---|---|---|
| NEE / NextEra Energy, Inc. | 0.55 | 24.84 | 37.91 | 22.25 | 11.8131 | 1.8131 | |||
| CEG / Constellation Energy Corporation | 0.09 | 36.17 | 29.58 | 117.97 | 9.2155 | 4.8402 | |||
| VST / Vistra Corp. | 0.14 | 50.31 | 27.35 | 148.08 | 8.5224 | 4.9669 | |||
| DUK / Duke Energy Corporation | 0.22 | -10.00 | 26.34 | -12.93 | 8.2052 | -1.5473 | |||
| SRE / Sempra | 0.25 | 49.16 | 19.24 | 58.37 | 5.9961 | 2.0780 | |||
| EXC / Exelon Corporation | 0.41 | -6.88 | 17.62 | -12.26 | 5.4898 | -0.9853 | |||
| ETR / Entergy Corporation | 0.18 | 7.94 | 15.14 | 4.95 | 4.7173 | 0.0656 | |||
| PPL / PPL Corporation | 0.38 | 4.58 | 12.78 | -1.85 | 3.9808 | -0.2166 | |||
| AEE / Ameren Corporation | 0.13 | -8.49 | 12.43 | -12.46 | 3.8720 | -0.7055 | |||
| XEL / Xcel Energy Inc. | 0.18 | 0.00 | 12.09 | -3.80 | 3.7681 | -0.2855 | |||
| CNP / CenterPoint Energy, Inc. | 0.33 | -18.71 | 11.99 | -17.57 | 3.7360 | -0.9540 | |||
| NRG / NRG Energy, Inc. | 0.07 | 14.13 | 11.50 | 103.16 | 3.5841 | 1.7970 | |||
| EVRG / Evergy, Inc. | 0.16 | -9.77 | 10.74 | -9.79 | 3.3447 | -0.4926 | |||
| SO / The Southern Company | 0.11 | -36.55 | 10.36 | -36.64 | 3.2270 | -2.0433 | |||
| PCG / PG&E Corporation | 0.71 | -2.09 | 9.93 | -20.56 | 3.0926 | -0.9360 | |||
| NI / NiSource Inc. | 0.25 | -6.04 | 9.91 | -5.46 | 3.0873 | -0.2922 | |||
| CCJ / Cameco Corporation | 0.12 | 8.66 | 2.6990 | 2.6990 | |||||
| GEV / GE Vernova Inc. | 0.01 | -2.26 | 6.88 | 69.41 | 2.1433 | 0.8341 | |||
| AEP / American Electric Power Company, Inc. | 0.06 | -39.14 | 6.41 | -42.21 | 1.9957 | -1.5781 | |||
| UGI / UGI Corporation | 0.14 | 4.55 | 5.03 | 15.12 | 1.5659 | 0.1584 | |||
| PWR / Quanta Services, Inc. | 0.01 | 302.27 | 5.02 | 1,095.00 | 1.5638 | 1.4084 | |||
| TXNM / TXNM Energy, Inc. | 0.09 | -50.94 | 5.00 | -48.34 | 1.5579 | -1.5630 | |||
| ES / Eversource Energy | 0.04 | -66.71 | 2.69 | -65.90 | 0.8366 | -1.7027 | |||
| GFL / GFL Environmental Inc. | 0.04 | 2.04 | 0.6352 | 0.6352 | |||||
| FSLR / First Solar, Inc. | 0.01 | 70.68 | 1.84 | 123.63 | 0.5722 | 0.3072 | |||
| US31635A3032 / Fidelity Securities Lending Cash Central Fund | 1.52 | 41.32 | 1.52 | 41.37 | 0.4750 | 0.1345 | |||
| TLN / Talen Energy Corporation | 0.01 | 0.42 | 1.45 | 46.28 | 0.4532 | 0.1325 | |||
| AES / The AES Corporation | 0.05 | -89.71 | 0.52 | -91.29 | 0.1609 | -1.7501 | |||
| US31635A1051 / Fidelity Cash Central Fund | 0.27 | -97.94 | 0.27 | -97.95 | 0.0841 | -4.1399 | |||
| BEP / Brookfield Renewable Partners L.P. - Limited Partnership | 0.00 | -100.00 | 0.00 | -100.00 | -0.3787 |