Basic Stats
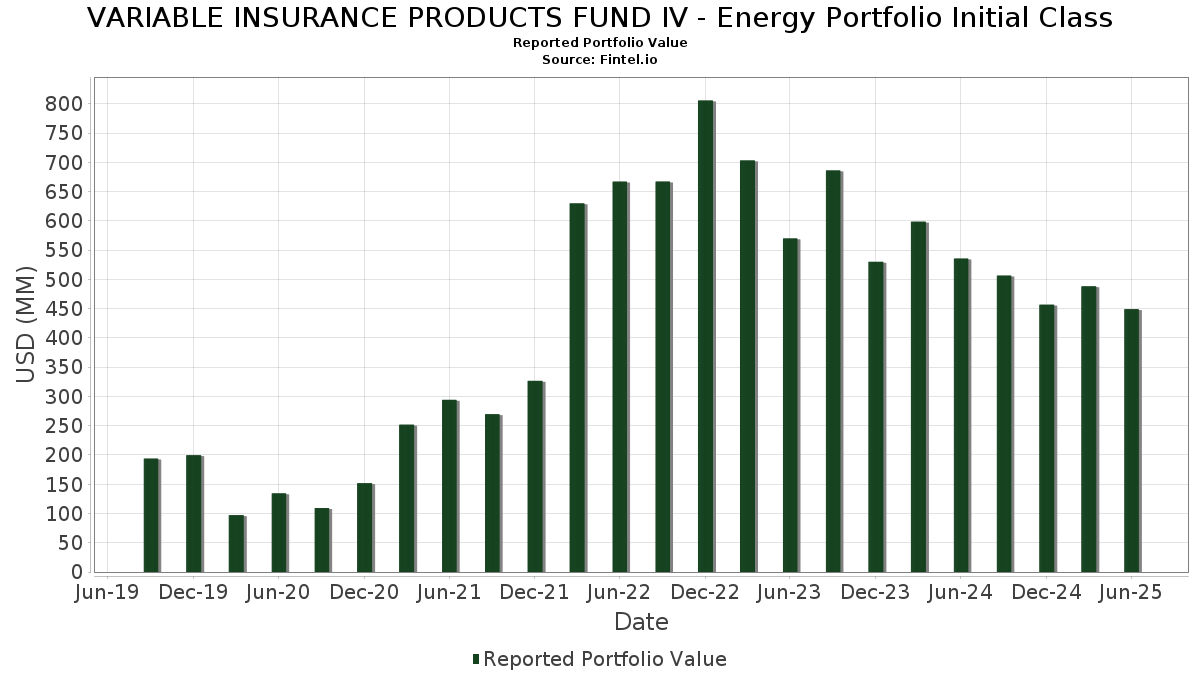
| Portfolio Value | $ 449,133,876 |
| Current Positions | 36 |
Latest Holdings, Performance, AUM (from 13F, 13D)
VARIABLE INSURANCE PRODUCTS FUND IV - Energy Portfolio Initial Class has disclosed 36 total holdings in their latest SEC filings. Most recent portfolio value is calculated to be $ 449,133,876 USD. Actual Assets Under Management (AUM) is this value plus cash (which is not disclosed). VARIABLE INSURANCE PRODUCTS FUND IV - Energy Portfolio Initial Class’s top holdings are Exxon Mobil Corporation (US:XOM) , Chevron Corporation (US:CVX) , Cheniere Energy, Inc. (US:LNG) , Energy Transfer LP - Limited Partnership (US:ET) , and Marathon Petroleum Corporation (US:MPC) .
Top Increases This Quarter
We use the change in the portfolio allocation because this is the most meaningful metric. Changes can be due to trades or changes in share prices.
| Security | Shares (MM) |
Value (MM$) |
Portfolio % | ΔPortfolio % |
|---|---|---|---|---|
| 0.09 | 18.07 | 4.0877 | 1.6969 | |
| 0.06 | 6.44 | 1.4577 | 1.4577 | |
| 0.14 | 8.90 | 2.0135 | 1.3832 | |
| 0.13 | 21.27 | 4.8130 | 0.8860 | |
| 0.12 | 16.03 | 3.6255 | 0.3404 | |
| 0.09 | 22.74 | 5.1450 | 0.2896 | |
| 0.34 | 4.59 | 1.0390 | 0.2785 | |
| 0.07 | 11.82 | 2.6740 | 0.1855 | |
| 0.62 | 19.39 | 4.3876 | 0.1244 | |
| 1.21 | 22.01 | 4.9798 | 0.1174 |
Top Decreases This Quarter
We use the change in the portfolio allocation because this is the most meaningful metric. Changes can be due to trades or changes in share prices.
| Security | Shares (MM) |
Value (MM$) |
Portfolio % | ΔPortfolio % |
|---|---|---|---|---|
| 1.01 | 109.04 | 24.6687 | -1.4771 | |
| 7.44 | 7.44 | 1.6841 | -1.4544 | |
| 0.23 | 9.54 | 2.1571 | -1.0636 | |
| 0.44 | 14.97 | 3.3863 | -1.0044 | |
| 0.07 | 2.74 | 0.6202 | -0.7383 | |
| 0.18 | 25.21 | 5.7036 | -0.3947 | |
| 1.27 | 17.26 | 3.9053 | -0.3586 | |
| 0.22 | 8.21 | 1.8573 | -0.2721 | |
| 0.13 | 12.02 | 2.7186 | -0.2393 | |
| 0.10 | 13.38 | 3.0276 | -0.2063 |
13F and Fund Filings
This form was filed on 2025-08-22 for the reporting period 2025-06-30. Click the link icon to see the full transaction history.
Upgrade to unlock premium data and export to Excel ![]() .
.
| Security | Type | Avg Share Price | Shares (MM) |
ΔShares (%) |
ΔShares (%) |
Value ($MM) |
Portfolio (%) |
ΔPortfolio (%) |
|
|---|---|---|---|---|---|---|---|---|---|
| XOM / Exxon Mobil Corporation | 1.01 | -2.86 | 109.04 | -11.95 | 24.6687 | -1.4771 | |||
| CVX / Chevron Corporation | 0.18 | 1.97 | 25.21 | -12.72 | 5.7036 | -0.3947 | |||
| LNG / Cheniere Energy, Inc. | 0.09 | -6.04 | 22.74 | -1.11 | 5.1450 | 0.2896 | |||
| ET / Energy Transfer LP - Limited Partnership | 1.21 | -2.00 | 22.01 | -4.42 | 4.9798 | 0.1174 | |||
| MPC / Marathon Petroleum Corporation | 0.13 | 0.31 | 21.27 | 14.37 | 4.8130 | 0.8860 | |||
| CNQ / Canadian Natural Resources Limited | 0.62 | -5.97 | 19.39 | -3.96 | 4.3876 | 0.1244 | |||
| VST / Vistra Corp. | 0.09 | -3.32 | 18.07 | 59.55 | 4.0877 | 1.6969 | |||
| CVE / Cenovus Energy Inc. | 1.27 | -12.70 | 17.26 | -14.53 | 3.9053 | -0.3586 | |||
| VLO / Valero Energy Corporation | 0.12 | 1.19 | 16.03 | 2.99 | 3.6255 | 0.3404 | |||
| SLB / Schlumberger Limited | 0.44 | -10.99 | 14.97 | -28.03 | 3.3863 | -1.0044 | |||
| HES / Hess Corporation | 0.10 | 0.73 | 13.38 | -12.64 | 3.0276 | -0.2063 | |||
| FTI / TechnipFMC plc | 0.38 | -14.33 | 13.14 | -6.90 | 2.9718 | -0.0069 | |||
| FANG / Diamondback Energy, Inc. | 0.09 | 1.82 | 12.32 | -12.50 | 2.7882 | -0.1854 | |||
| COP / ConocoPhillips | 0.13 | 0.37 | 12.02 | -14.23 | 2.7186 | -0.2393 | |||
| TRGP / Targa Resources Corp. | 0.07 | 15.48 | 11.82 | 0.28 | 2.6740 | 0.1855 | |||
| BKR / Baker Hughes Company | 0.25 | -0.32 | 9.62 | -13.04 | 2.1754 | -0.1591 | |||
| OXY / Occidental Petroleum Corporation | 0.23 | -26.56 | 9.54 | -37.50 | 2.1571 | -1.0636 | |||
| WMB / The Williams Companies, Inc. | 0.14 | 120.27 | 8.90 | 433.57 | 2.0135 | 1.3832 | |||
| AR / Antero Resources Corporation | 0.21 | -8.22 | 8.41 | -8.59 | 1.9023 | -0.0396 | |||
| OVV / Ovintiv Inc. | 0.22 | -8.44 | 8.21 | -18.61 | 1.8573 | -0.2721 | |||
| US31635A3032 / Fidelity Securities Lending Cash Central Fund | 7.44 | -49.93 | 7.44 | -49.93 | 1.6841 | -1.4544 | |||
| RRC / Range Resources Corporation | 0.18 | -5.68 | 7.30 | -3.94 | 1.6512 | 0.0473 | |||
| EXE / Expand Energy Corporation | 0.06 | 6.44 | 1.4577 | 1.4577 | |||||
| NESR / National Energy Services Reunited Corp. | 1.03 | 2.07 | 6.19 | -16.51 | 1.4007 | -0.1649 | |||
| IMO / Imperial Oil Limited | 0.07 | -14.93 | 5.66 | -6.45 | 1.2796 | 0.0032 | |||
| PSX / Phillips 66 | 0.05 | -2.31 | 5.54 | -5.62 | 1.2532 | 0.0141 | |||
| PR / Permian Resources Corporation | 0.34 | 29.64 | 4.59 | 27.48 | 1.0390 | 0.2785 | |||
| VAL / Valaris Limited | 0.07 | -60.28 | 2.74 | -57.40 | 0.6202 | -0.7383 | |||
| CHRD / Chord Energy Corporation | 0.02 | 19.36 | 2.21 | 2.55 | 0.4999 | 0.0450 | |||
| GTLS / Chart Industries, Inc. | 0.01 | -32.58 | 1.98 | -23.12 | 0.4470 | -0.0955 | |||
| EOG / EOG Resources, Inc. | 0.02 | -7.23 | 1.84 | -13.48 | 0.4168 | -0.0327 | |||
| ODL / Odfjell Drilling Ltd. | 0.17 | -9.51 | 1.13 | 8.37 | 0.2550 | 0.0355 | |||
| US31635A1051 / Fidelity Cash Central Fund | 0.88 | -17.40 | 0.88 | -17.35 | 0.1994 | -0.0259 | |||
| SOC / Subsea 7 S.A. | 0.04 | 70.98 | 0.72 | 101.97 | 0.1627 | 0.0874 | |||
| VK / Vallourec S.A. | 0.04 | 0.00 | 0.65 | -2.10 | 0.1476 | 0.0070 | |||
| NOG / Northern Oil and Gas, Inc. | 0.02 | -47.53 | 0.47 | -50.79 | 0.1055 | -0.0946 |