Basic Stats
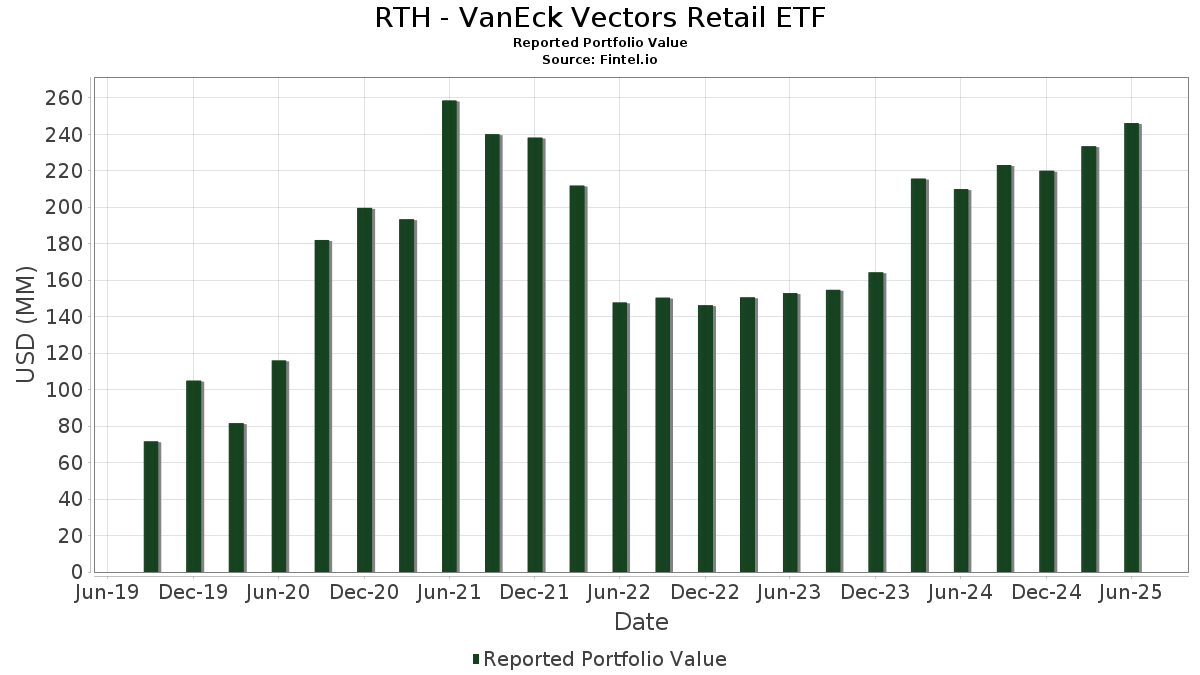
| Portfolio Value | $ 246,100,671 |
| Current Positions | 25 |
Latest Holdings, Performance, AUM (from 13F, 13D)
RTH - VanEck Vectors Retail ETF has disclosed 25 total holdings in their latest SEC filings. Most recent portfolio value is calculated to be $ 246,100,671 USD. Actual Assets Under Management (AUM) is this value plus cash (which is not disclosed). RTH - VanEck Vectors Retail ETF’s top holdings are Amazon.com, Inc. (US:AMZN) , Walmart Inc. (US:WMT) , Costco Wholesale Corporation (US:COST) , The Home Depot, Inc. (US:HD) , and The TJX Companies, Inc. (US:TJX) .
Top Increases This Quarter
We use the change in the portfolio allocation because this is the most meaningful metric. Changes can be due to trades or changes in share prices.
| Security | Shares (MM) |
Value (MM$) |
Portfolio % | ΔPortfolio % |
|---|---|---|---|---|
| 0.23 | 49.87 | 20.2600 | 1.5032 | |
| 0.02 | 5.92 | 2.4048 | 0.9547 | |
| 0.03 | 5.59 | 2.2728 | 0.4987 | |
| 0.03 | 8.22 | 3.3387 | 0.4249 | |
| 0.23 | 22.61 | 9.1860 | 0.4073 | |
| 0.03 | 2.75 | 1.1160 | 0.2428 | |
| 0.03 | 3.32 | 1.3489 | 0.1362 | |
| 0.01 | 2.89 | 1.1757 | 0.1230 | |
| 0.17 | 11.45 | 4.6496 | 0.0399 | |
| 0.11 | 1.22 | 0.4943 | 0.0021 |
Top Decreases This Quarter
We use the change in the portfolio allocation because this is the most meaningful metric. Changes can be due to trades or changes in share prices.
| Security | Shares (MM) |
Value (MM$) |
Portfolio % | ΔPortfolio % |
|---|---|---|---|---|
| 0.23 | 7.55 | 3.0688 | -1.4248 | |
| 0.01 | 3.56 | 1.4445 | -0.4193 | |
| 0.05 | 17.50 | 7.1101 | -0.4122 | |
| 0.06 | 5.92 | 2.4034 | -0.4081 | |
| 0.12 | 10.92 | 4.4358 | -0.3914 | |
| 0.04 | 5.54 | 2.2494 | -0.2955 | |
| 0.10 | 12.01 | 4.8810 | -0.2954 | |
| 0.07 | 3.75 | 1.5216 | -0.2922 | |
| 0.09 | 6.57 | 2.6707 | -0.1323 | |
| 0.02 | 21.07 | 8.5614 | -0.1135 |
13F and Fund Filings
This form was filed on 2025-08-21 for the reporting period 2025-06-30. Click the link icon to see the full transaction history.
Upgrade to unlock premium data and export to Excel ![]() .
.
| Security | Type | Avg Share Price | Shares (MM) |
ΔShares (%) |
ΔShares (%) |
Value ($MM) |
Portfolio (%) |
ΔPortfolio (%) |
|
|---|---|---|---|---|---|---|---|---|---|
| AMZN / Amazon.com, Inc. | 0.23 | -0.99 | 49.87 | 14.17 | 20.2600 | 1.5032 | |||
| WMT / Walmart Inc. | 0.23 | -0.70 | 22.61 | 10.61 | 9.1860 | 0.4073 | |||
| COST / Costco Wholesale Corporation | 0.02 | -0.34 | 21.07 | 4.32 | 8.5614 | -0.1135 | |||
| HD / The Home Depot, Inc. | 0.05 | -0.13 | 17.50 | -0.09 | 7.1101 | -0.4122 | |||
| TJX / The TJX Companies, Inc. | 0.10 | -1.70 | 12.01 | -0.33 | 4.8810 | -0.2954 | |||
| CVS / CVS Health Corporation | 0.17 | 4.71 | 11.45 | 6.62 | 4.6496 | 0.0399 | |||
| MCK / McKesson Corporation | 0.02 | -5.26 | 11.13 | 3.15 | 4.5226 | -0.1116 | |||
| ORLY / O'Reilly Automotive, Inc. | 0.12 | 1,443.81 | 10.92 | -2.87 | 4.4358 | -0.3914 | |||
| LOW / Lowe's Companies, Inc. | 0.05 | 9.36 | 10.92 | 4.03 | 4.4353 | -0.0710 | |||
| AZO / AutoZone, Inc. | 0.00 | 7.10 | 9.01 | 4.28 | 3.6617 | -0.0499 | |||
| COR / Cencora, Inc. | 0.03 | 12.32 | 8.22 | 21.12 | 3.3387 | 0.4249 | |||
| JD / JD.com, Inc. - Depositary Receipt (Common Stock) | 0.23 | -9.06 | 7.55 | -27.82 | 3.0688 | -1.4248 | |||
| KR / The Kroger Co. | 0.09 | -4.96 | 6.57 | 0.70 | 2.6707 | -0.1323 | |||
| CVNA / Carvana Co. | 0.02 | 8.77 | 5.92 | 75.33 | 2.4048 | 0.9547 | |||
| TGT / Target Corporation | 0.06 | -4.41 | 5.92 | -9.65 | 2.4034 | -0.4081 | |||
| CAH / Cardinal Health, Inc. | 0.03 | 11.05 | 5.59 | 35.42 | 2.2728 | 0.4987 | |||
| ROST / Ross Stores, Inc. | 0.04 | -6.42 | 5.54 | -6.58 | 2.2494 | -0.2955 | |||
| SYY / Sysco Corporation | 0.07 | 2.34 | 5.12 | 3.29 | 2.0811 | -0.0485 | |||
| TSCO / Tractor Supply Company | 0.07 | -7.41 | 3.75 | -11.32 | 1.5216 | -0.2922 | |||
| LULU / lululemon athletica inc. | 0.01 | -2.40 | 3.56 | -18.09 | 1.4445 | -0.4193 | |||
| DG / Dollar General Corporation | 0.03 | -9.62 | 3.32 | 17.56 | 1.3489 | 0.1362 | |||
| ULTA / Ulta Beauty, Inc. | 0.01 | -7.51 | 2.89 | 18.03 | 1.1757 | 0.1230 | |||
| DLTR / Dollar Tree, Inc. | 0.03 | 2.40 | 2.75 | 35.07 | 1.1160 | 0.2428 | |||
| BBY / Best Buy Co., Inc. | 0.03 | 0.66 | 1.69 | -8.22 | 0.6858 | -0.1038 | |||
| WBA / Walgreens Boots Alliance, Inc. | 0.11 | 3.28 | 1.22 | 6.11 | 0.4943 | 0.0021 |