Basic Stats
| Portfolio Value | $ 529,946,619 |
| Current Positions | 77 |
Latest Holdings, Performance, AUM (from 13F, 13D)
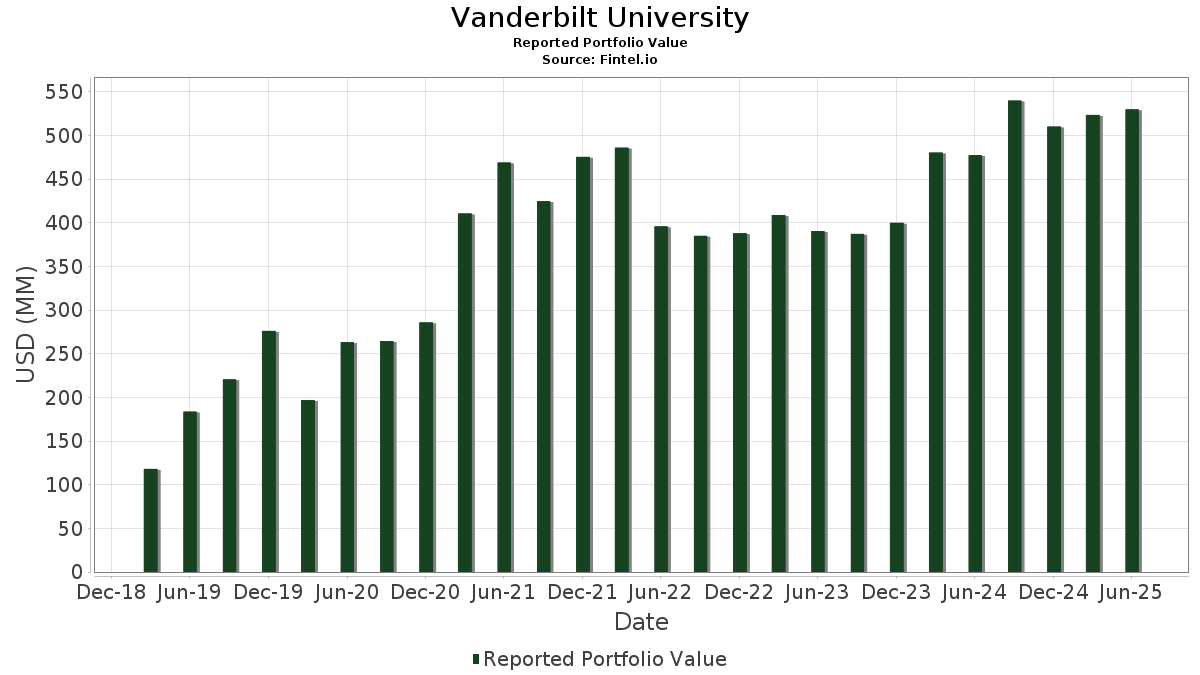
Vanderbilt University has disclosed 77 total holdings in their latest SEC filings. Most recent portfolio value is calculated to be $ 529,946,619 USD. Actual Assets Under Management (AUM) is this value plus cash (which is not disclosed). Vanderbilt University’s top holdings are Invesco Exchange-Traded Fund Trust - Invesco S&P 500 Equal Weight ETF (US:RSP) , Vanguard Specialized Funds - Vanguard Real Estate ETF (US:VNQ) , SPDR Series Trust - SPDR S&P Metals & Mining ETF (US:XME) , SPDR Series Trust - SPDR S&P Oil & Gas Exploration & Production ETF (US:XOP) , and VanEck ETF Trust - VanEck Gold Miners ETF (US:GDX) . Vanderbilt University’s new positions include TransDigm Group Incorporated (US:TDG) , Corpay, Inc. (US:FLT) , Phillips Edison & Company, Inc. (US:PECO) , .
Top Increases This Quarter
We use the change in the portfolio allocation because this is the most meaningful metric. Changes can be due to trades or changes in share prices.
| Security | Shares (MM) |
Value (MM$) |
Portfolio % | ΔPortfolio % |
|---|---|---|---|---|
| 0.16 | 13.16 | 2.4842 | 2.4842 | |
| 0.97 | 65.29 | 12.3208 | 1.9488 | |
| 0.01 | 7.93 | 1.4958 | 1.4958 | |
| 0.01 | 3.55 | 0.6700 | 0.6700 | |
| 0.00 | 3.55 | 0.6697 | 0.6697 | |
| 0.46 | 84.18 | 15.8839 | 0.6198 | |
| 0.00 | 7.92 | 1.4944 | 0.4297 | |
| 0.01 | 8.76 | 1.6527 | 0.4031 | |
| 0.11 | 9.16 | 1.7293 | 0.3949 | |
| 0.03 | 7.07 | 1.3332 | 0.3873 |
Top Decreases This Quarter
We use the change in the portfolio allocation because this is the most meaningful metric. Changes can be due to trades or changes in share prices.
| Security | Shares (MM) |
Value (MM$) |
Portfolio % | ΔPortfolio % |
|---|---|---|---|---|
| 0.81 | 42.38 | 7.9965 | -1.6471 | |
| 0.02 | 0.82 | 0.1553 | -1.4360 | |
| 0.11 | 3.07 | 0.5785 | -0.4988 | |
| 0.36 | 44.92 | 8.4763 | -0.4521 | |
| 0.00 | 3.85 | 0.7259 | -0.4326 | |
| 0.00 | 1.32 | 0.2484 | -0.3724 | |
| 0.01 | 1.28 | 0.2417 | -0.3631 | |
| 0.16 | 11.07 | 2.0894 | -0.3121 | |
| 0.84 | 74.86 | 14.1268 | -0.2659 | |
| 0.07 | 2.44 | 0.4605 | -0.2418 |
13F and Fund Filings
This form was filed on 2025-07-21 for the reporting period 2025-06-30. Click the link icon to see the full transaction history.
Upgrade to unlock premium data and export to Excel ![]() .
.
| Security | Type | Avg Share Price | Shares (MM) |
ΔShares (%) |
ΔShares (%) |
Value ($MM) |
Portfolio (%) |
ΔPortfolio (%) |
|
|---|---|---|---|---|---|---|---|---|---|
| RSP / Invesco Exchange-Traded Fund Trust - Invesco S&P 500 Equal Weight ETF | 0.46 | 0.40 | 84.18 | 5.33 | 15.8839 | 0.6198 | |||
| VNQ / Vanguard Specialized Funds - Vanguard Real Estate ETF | 0.84 | 1.00 | 74.86 | -0.65 | 14.1268 | -0.2659 | |||
| XME / SPDR Series Trust - SPDR S&P Metals & Mining ETF | 0.97 | 0.15 | 65.29 | 20.24 | 12.3208 | 1.9488 | |||
| XOP / SPDR Series Trust - SPDR S&P Oil & Gas Exploration & Production ETF | 0.36 | 0.61 | 44.92 | -3.90 | 8.4763 | -0.4521 | |||
| GDX / VanEck ETF Trust - VanEck Gold Miners ETF | 0.81 | -25.89 | 42.38 | -16.07 | 7.9965 | -1.6471 | |||
| XBI / SPDR Series Trust - SPDR S&P Biotech ETF | 0.16 | 13.16 | 2.4842 | 2.4842 | |||||
| GDXJ / VanEck ETF Trust - VanEck Junior Gold Miners ETF | 0.16 | -25.47 | 11.07 | -11.94 | 2.0894 | -0.3121 | |||
| AMT / American Tower Corporation | 0.04 | 8.11 | 9.86 | 9.80 | 1.8601 | 0.1454 | |||
| CSGP / CoStar Group, Inc. | 0.11 | 29.26 | 9.16 | 31.18 | 1.7293 | 0.3949 | |||
| META / Meta Platforms, Inc. | 0.01 | 4.54 | 8.76 | 33.87 | 1.6527 | 0.4031 | |||
| INTU / Intuit Inc. | 0.01 | 7.93 | 1.4958 | 1.4958 | |||||
| BKNG / Booking Holdings Inc. | 0.00 | 13.06 | 7.92 | 42.07 | 1.4944 | 0.4297 | |||
| GOOGL / Alphabet Inc. | 0.04 | -14.50 | 7.89 | -2.56 | 1.4890 | -0.0578 | |||
| AMZN / Amazon.com, Inc. | 0.03 | 23.73 | 7.07 | 42.67 | 1.3332 | 0.3873 | |||
| MSFT / Microsoft Corporation | 0.01 | -27.49 | 7.02 | -3.93 | 1.3256 | -0.0709 | |||
| CP / Canadian Pacific Kansas City Limited | 0.08 | 10.31 | 5.98 | 24.63 | 1.1288 | 0.2120 | |||
| DLR / Digital Realty Trust, Inc. | 0.03 | 7.70 | 5.88 | 31.02 | 1.1102 | 0.2526 | |||
| PLD / Prologis, Inc. | 0.05 | 17.76 | 5.71 | 10.74 | 1.0782 | 0.0926 | |||
| ESTC / Elastic N.V. | 0.07 | 12.19 | 5.52 | 6.19 | 1.0421 | 0.0487 | |||
| WELL / Welltower Inc. | 0.04 | -7.01 | 5.50 | -6.69 | 1.0370 | -0.0880 | |||
| KSA / iShares Trust - iShares MSCI Saudi Arabia ETF | 0.13 | 2.57 | 4.92 | -4.43 | 0.9275 | -0.0550 | |||
| SPG / Simon Property Group, Inc. | 0.03 | 12.10 | 4.70 | 8.49 | 0.8870 | 0.0596 | |||
| PCOR / Procore Technologies, Inc. | 0.07 | 13.58 | 4.49 | 17.71 | 0.8466 | 0.1186 | |||
| MSCI / MSCI Inc. | 0.01 | 4.93 | 4.00 | 7.01 | 0.7553 | 0.0409 | |||
| TYL / Tyler Technologies, Inc. | 0.01 | 11.89 | 3.97 | 14.10 | 0.7497 | 0.0846 | |||
| EQIX / Equinix, Inc. | 0.00 | -34.99 | 3.85 | -36.59 | 0.7259 | -0.4326 | |||
| V / Visa Inc. | 0.01 | 3.55 | 0.6700 | 0.6700 | |||||
| TDG / TransDigm Group Incorporated | 0.00 | 3.55 | 0.6697 | 0.6697 | |||||
| ENTG / Entegris, Inc. | 0.04 | -0.57 | 3.23 | -8.34 | 0.6099 | -0.0635 | |||
| MCO / Moody's Corporation | 0.01 | 32.84 | 3.14 | 43.07 | 0.5918 | 0.1732 | |||
| FER / Ferrovial SE | 0.06 | 2.43 | 3.14 | 22.36 | 0.5918 | 0.1022 | |||
| GLPI / Gaming and Leisure Properties, Inc. | 0.07 | 112.21 | 3.11 | 94.68 | 0.5868 | 0.2816 | |||
| NCNO / nCino, Inc. | 0.11 | -46.62 | 3.07 | -45.66 | 0.5785 | -0.4988 | |||
| SBAC / SBA Communications Corporation | 0.01 | 51.15 | 2.63 | 61.29 | 0.4963 | 0.1849 | |||
| ELS / Equity LifeStyle Properties, Inc. | 0.04 | 214.15 | 2.57 | 190.60 | 0.4843 | 0.3155 | |||
| VTR / Ventas, Inc. | 0.04 | 304.58 | 2.56 | 271.80 | 0.4827 | 0.3512 | |||
| VICI / VICI Properties Inc. | 0.07 | -33.59 | 2.44 | -33.62 | 0.4605 | -0.2418 | |||
| INVH / Invitation Homes Inc. | 0.07 | 0.37 | 2.24 | -5.56 | 0.4235 | -0.0303 | |||
| ESS / Essex Property Trust, Inc. | 0.01 | -0.91 | 2.06 | -8.37 | 0.3882 | -0.0408 | |||
| AVB / AvalonBay Communities, Inc. | 0.01 | 23.17 | 2.06 | 16.76 | 0.3879 | 0.0517 | |||
| ADC / Agree Realty Corporation | 0.03 | 11.49 | 1.83 | 5.53 | 0.3457 | 0.0141 | |||
| O / Realty Income Corporation | 0.03 | -17.21 | 1.83 | -17.78 | 0.3448 | -0.0797 | |||
| EQR / Equity Residential | 0.03 | 28.20 | 1.80 | 20.86 | 0.3402 | 0.0553 | |||
| UDR / UDR, Inc. | 0.04 | 192.03 | 1.74 | 164.24 | 0.3291 | 0.2029 | |||
| EPRT / Essential Properties Realty Trust, Inc. | 0.05 | 11.89 | 1.71 | 9.42 | 0.3224 | 0.0241 | |||
| MAC / The Macerich Company | 0.10 | 47.63 | 1.64 | 39.17 | 0.3092 | 0.0842 | |||
| FLT / Corpay, Inc. | 0.00 | 1.61 | 0.3045 | 0.3045 | |||||
| CUBE / CubeSmart | 0.04 | 130.33 | 1.55 | 129.23 | 0.2917 | 0.1629 | |||
| BSX / Boston Scientific Corporation | 0.01 | 1.48 | 0.2793 | 0.2793 | |||||
| EXR / Extra Space Storage Inc. | 0.01 | -46.74 | 1.36 | -47.10 | 0.2568 | -0.2348 | |||
| PSA / Public Storage | 0.00 | -58.69 | 1.32 | -59.50 | 0.2484 | -0.3724 | |||
| OHI / Omega Healthcare Investors, Inc. | 0.04 | 1.32 | 0.2483 | 0.2483 | |||||
| CCI / Crown Castle Inc. | 0.01 | -58.96 | 1.28 | -59.54 | 0.2417 | -0.3631 | |||
| COLD / Americold Realty Trust, Inc. | 0.07 | 54.27 | 1.22 | 19.57 | 0.2295 | 0.0352 | |||
| SUI / Sun Communities, Inc. | 0.01 | -0.95 | 1.13 | -2.58 | 0.2141 | -0.0084 | |||
| FRT / Federal Realty Investment Trust | 0.01 | 4.01 | 1.09 | 0.93 | 0.2051 | -0.0005 | |||
| KIM / Kimco Realty Corporation | 0.05 | 0.97 | 0.1829 | 0.1829 | |||||
| KRG / Kite Realty Group Trust | 0.04 | 1.04 | 0.88 | 2.33 | 0.1659 | 0.0017 | |||
| ARE / Alexandria Real Estate Equities, Inc. | 0.01 | -1.33 | 0.85 | -22.49 | 0.1600 | -0.0491 | |||
| STAG / STAG Industrial, Inc. | 0.02 | -50.01 | 0.85 | -49.82 | 0.1598 | -0.1623 | |||
| CPT / Camden Property Trust | 0.01 | 82.23 | 0.84 | 68.07 | 0.1581 | 0.0628 | |||
| FR / First Industrial Realty Trust, Inc. | 0.02 | -88.92 | 0.82 | -90.12 | 0.1553 | -1.4360 | |||
| HST / Host Hotels & Resorts, Inc. | 0.05 | -4.08 | 0.81 | 3.60 | 0.1521 | 0.0036 | |||
| BXP / Boston Properties, Inc. | 0.01 | 0.74 | 0.1387 | 0.1387 | |||||
| IVT / InvenTrust Properties Corp. | 0.02 | 5.30 | 0.67 | -1.76 | 0.1264 | -0.0038 | |||
| NNN / NNN REIT, Inc. | 0.01 | -1.48 | 0.55 | -0.36 | 0.1043 | -0.0015 | |||
| VNO / Vornado Realty Trust | 0.01 | -31.37 | 0.45 | -29.09 | 0.0852 | -0.0363 | |||
| RHP / Ryman Hospitality Properties, Inc. | 0.00 | -16.42 | 0.42 | -9.87 | 0.0793 | -0.0097 | |||
| PECO / Phillips Edison & Company, Inc. | 0.01 | 0.31 | 0.0583 | 0.0583 | |||||
| EPR / EPR Properties | 0.01 | -2.35 | 0.30 | 8.24 | 0.0571 | 0.0036 | |||
| APLE / Apple Hospitality REIT, Inc. | 0.02 | 39.94 | 0.25 | 26.63 | 0.0477 | 0.0095 | |||
| SKT / Tanger Inc. | 0.01 | -61.92 | 0.24 | -65.50 | 0.0447 | -0.0867 | |||
| BNL / Broadstone Net Lease, Inc. | 0.01 | -2.23 | 0.22 | -8.09 | 0.0409 | -0.0041 | |||
| MPW / Medical Properties Trust, Inc. | 0.04 | 0.00 | 0.19 | -28.57 | 0.0350 | -0.0145 | |||
| PK / Park Hotels & Resorts Inc. | 0.01 | -4.87 | 0.14 | -8.61 | 0.0260 | -0.0029 | |||
| SHO / Sunstone Hotel Investors, Inc. | 0.01 | -0.66 | 0.12 | -8.53 | 0.0224 | -0.0023 | |||
| DRH / DiamondRock Hospitality Company | 0.01 | -0.46 | 0.11 | -0.90 | 0.0208 | -0.0005 | |||
| GEV / GE Vernova Inc. | 0.00 | -100.00 | 0.00 | 0.0000 | |||||
| AER / AerCap Holdings N.V. | 0.00 | -100.00 | 0.00 | 0.0000 | |||||
| NU / Nu Holdings Ltd. | 0.00 | -100.00 | 0.00 | 0.0000 | |||||
| DHR / Danaher Corporation | 0.00 | -100.00 | 0.00 | 0.0000 | |||||
| CUZ / Cousins Properties Incorporated | 0.00 | -100.00 | 0.00 | 0.0000 | |||||
| DOC / Healthpeak Properties, Inc. | 0.00 | -100.00 | 0.00 | 0.0000 | |||||
| SBRA / Sabra Health Care REIT, Inc. | 0.00 | -100.00 | 0.00 | 0.0000 | |||||
| LINE / Lineage, Inc. | 0.00 | -100.00 | 0.00 | 0.0000 | |||||
| PDM / Piedmont Realty Trust, Inc. | 0.00 | -100.00 | 0.00 | 0.0000 | |||||
| ELME / Elme Communities | 0.00 | -100.00 | 0.00 | 0.0000 |