Basic Stats
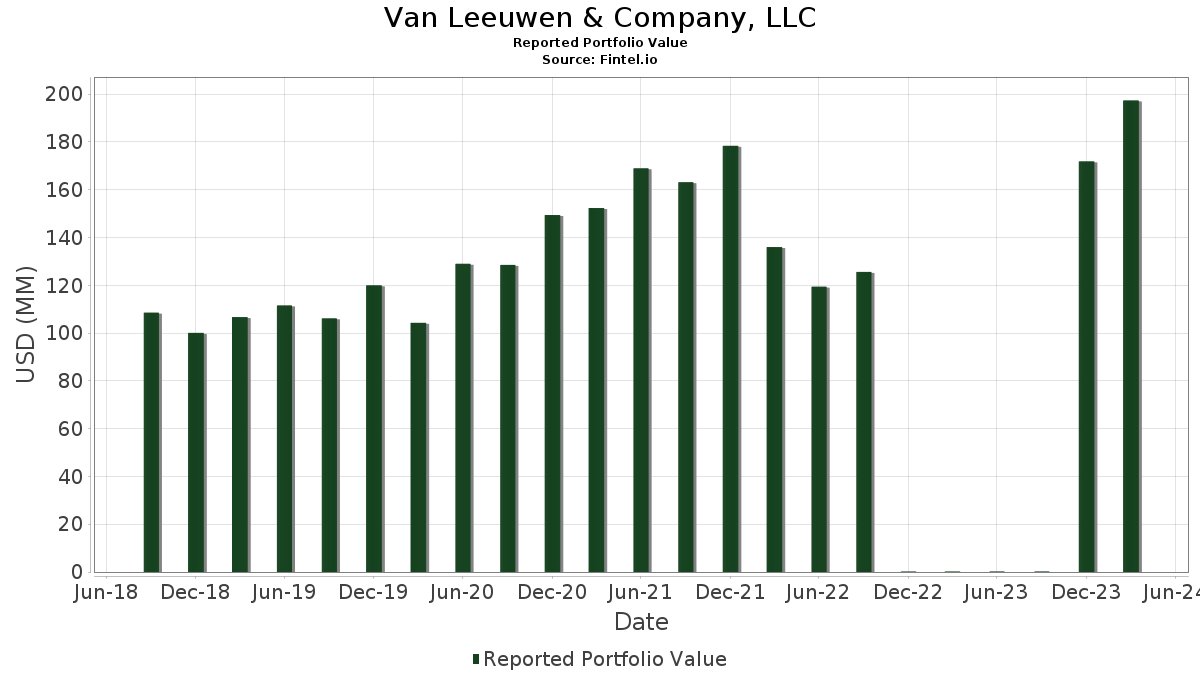
| Portfolio Value | $ 197,282,101 |
| Current Positions | 88 |
Latest Holdings, Performance, AUM (from 13F, 13D)
Van Leeuwen & Company, LLC has disclosed 88 total holdings in their latest SEC filings. Most recent portfolio value is calculated to be $ 197,282,101 USD. Actual Assets Under Management (AUM) is this value plus cash (which is not disclosed). Van Leeuwen & Company, LLC’s top holdings are Microsoft Corporation (US:MSFT) , Alphabet Inc. (US:GOOG) , Berkshire Hathaway Inc. (US:BRK.B) , Visa Inc. (US:V) , and Vertex Pharmaceuticals Incorporated (US:VRTX) . Van Leeuwen & Company, LLC’s new positions include AppLovin Corporation (US:APP) , Palo Alto Networks, Inc. (US:PANW) , The Hartford Insurance Group, Inc. (US:HIG) , Celanese Corporation (US:CE) , and Palantir Technologies Inc. (US:PLTR) .
Top Increases This Quarter
We use the change in the portfolio allocation because this is the most meaningful metric. Changes can be due to trades or changes in share prices.
| Security | Shares (MM) |
Value (MM$) |
Portfolio % | ΔPortfolio % |
|---|---|---|---|---|
| 0.03 | 4.32 | 2.1887 | 2.1887 | |
| 0.02 | 6.42 | 3.2536 | 1.6710 | |
| 0.02 | 3.22 | 1.6308 | 1.6308 | |
| 0.01 | 2.24 | 1.1359 | 1.1359 | |
| 0.01 | 6.39 | 3.2385 | 1.1174 | |
| 0.03 | 2.14 | 1.0843 | 1.0843 | |
| 0.01 | 1.80 | 0.9109 | 0.9109 | |
| 0.02 | 1.79 | 0.9073 | 0.9073 | |
| 0.02 | 2.48 | 1.2588 | 0.6682 | |
| 0.01 | 3.21 | 1.6249 | 0.6350 |
Top Decreases This Quarter
We use the change in the portfolio allocation because this is the most meaningful metric. Changes can be due to trades or changes in share prices.
| Security | Shares (MM) |
Value (MM$) |
Portfolio % | ΔPortfolio % |
|---|---|---|---|---|
| 0.03 | 5.75 | 2.9154 | -2.0744 | |
| 0.00 | 1.80 | 0.9130 | -1.1161 | |
| 0.05 | 7.71 | 3.9074 | -0.7430 | |
| 0.02 | 6.70 | 3.3944 | -0.4752 | |
| 0.05 | 2.82 | 1.4301 | -0.4198 | |
| 0.05 | 6.63 | 3.3622 | -0.3444 | |
| 0.03 | 3.51 | 1.7767 | -0.2605 | |
| 0.00 | 0.80 | 0.4080 | -0.2419 | |
| 0.02 | 6.80 | 3.4484 | -0.2348 | |
| 0.02 | 1.74 | 0.8836 | -0.2112 |
13F and Fund Filings
This form was filed on 2024-05-10 for the reporting period 2024-03-31. Click the link icon to see the full transaction history.
Upgrade to unlock premium data and export to Excel ![]() .
.
| Security | Type | Avg Share Price | Shares (MM) |
ΔShares (%) |
ΔShares (%) |
Value ($MM) |
Portfolio (%) |
ΔPortfolio (%) |
|
|---|---|---|---|---|---|---|---|---|---|
| MSFT / Microsoft Corporation | 0.02 | 1.87 | 9.08 | 13.96 | 4.6049 | -0.0351 | |||
| GOOG / Alphabet Inc. | 0.05 | -10.69 | 7.71 | -3.51 | 3.9074 | -0.7430 | |||
| BRK.B / Berkshire Hathaway Inc. | 0.02 | -1.09 | 7.04 | 16.62 | 3.5685 | 0.0543 | |||
| V / Visa Inc. | 0.02 | 0.30 | 6.80 | 7.52 | 3.4484 | -0.2348 | |||
| VRTX / Vertex Pharmaceuticals Incorporated | 0.02 | -1.94 | 6.70 | 0.74 | 3.3944 | -0.4752 | |||
| ROST / Ross Stores, Inc. | 0.05 | -1.77 | 6.63 | 4.18 | 3.3622 | -0.3444 | |||
| HUBB / Hubbell Incorporated | 0.02 | 87.11 | 6.42 | 136.13 | 3.2536 | 1.6710 | |||
| NVDA / NVIDIA Corporation | 0.01 | -3.90 | 6.39 | 75.38 | 3.2385 | 1.1174 | |||
| AAPL / Apple Inc. | 0.03 | -24.66 | 5.75 | -32.90 | 2.9154 | -2.0744 | |||
| EFA / iShares Trust - iShares MSCI EAFE ETF | 0.06 | 1.40 | 5.03 | 7.47 | 2.5512 | -0.1751 | |||
| AVGO / Broadcom Inc. | 0.00 | -6.96 | 4.75 | 10.47 | 2.4068 | -0.0952 | |||
| LLY / Eli Lilly and Company | 0.01 | 0.30 | 4.39 | 33.88 | 2.2233 | 0.3159 | |||
| QCOM / QUALCOMM Incorporated | 0.03 | 4.32 | 2.1887 | 2.1887 | |||||
| IR / Ingersoll Rand Inc. | 0.05 | 20.33 | 4.31 | 47.72 | 2.1846 | 0.4863 | |||
| XLE / The Select Sector SPDR Trust - The Energy Select Sector SPDR Fund | 0.04 | 23.68 | 4.12 | 39.27 | 2.0892 | 0.3666 | |||
| META / Meta Platforms, Inc. | 0.01 | -10.54 | 3.69 | 22.74 | 1.8690 | 0.1200 | |||
| RSP / Invesco Exchange-Traded Fund Trust - Invesco S&P 500 Equal Weight ETF | 0.02 | 1.77 | 3.60 | 9.23 | 1.8233 | -0.0937 | |||
| TJX / The TJX Companies, Inc. | 0.03 | -7.36 | 3.51 | 0.17 | 1.7767 | -0.2605 | |||
| AMZN / Amazon.com, Inc. | 0.02 | 3.55 | 3.28 | 22.94 | 1.6604 | 0.1092 | |||
| GLD / SPDR Gold Trust | 0.02 | 3.22 | 1.6308 | 1.6308 | |||||
| ELV / Elevance Health, Inc. | 0.01 | 71.44 | 3.21 | 88.53 | 1.6249 | 0.6350 | |||
| WFC / Wells Fargo & Company | 0.05 | -10.00 | 2.93 | 5.96 | 1.4866 | -0.1243 | |||
| BMY / Bristol-Myers Squibb Company | 0.05 | -16.00 | 2.82 | -11.21 | 1.4301 | -0.4198 | |||
| DIS / The Walt Disney Company | 0.02 | 80.64 | 2.48 | 144.87 | 1.2588 | 0.6682 | |||
| PCAR / PACCAR Inc | 0.02 | 1.17 | 2.46 | 28.31 | 1.2479 | 0.1313 | |||
| PSX / Phillips 66 | 0.01 | 0.16 | 2.42 | 22.88 | 1.2281 | 0.0804 | |||
| MOH / Molina Healthcare, Inc. | 0.01 | 83.62 | 2.38 | 108.88 | 1.2049 | 0.5422 | |||
| AMAT / Applied Materials, Inc. | 0.01 | -0.20 | 2.37 | 27.05 | 1.1999 | 0.1148 | |||
| PH / Parker-Hannifin Corporation | 0.00 | 0.48 | 2.34 | 21.21 | 1.1849 | 0.0623 | |||
| LRCX / Lam Research Corporation | 0.00 | -9.95 | 2.26 | 11.67 | 1.1455 | -0.0322 | |||
| CI / The Cigna Group | 0.01 | 2.24 | 1.1359 | 1.1359 | |||||
| DELL / Dell Technologies Inc. | 0.02 | -20.01 | 2.24 | 19.36 | 1.1344 | 0.0426 | |||
| GWW / W.W. Grainger, Inc. | 0.00 | -10.57 | 2.21 | 9.78 | 1.1216 | -0.0516 | |||
| TXT / Textron Inc. | 0.02 | 1.41 | 2.18 | 20.98 | 1.1054 | 0.0560 | |||
| JNJ / Johnson & Johnson | 0.01 | 1.00 | 2.18 | 1.97 | 1.1036 | -0.1398 | |||
| XPRO / Expro Group Holdings N.V. | 0.01 | 3.09 | 2.17 | 24.01 | 1.0998 | 0.0815 | |||
| CRM / Salesforce, Inc. | 0.01 | 0.64 | 2.17 | 15.16 | 1.0978 | 0.0034 | |||
| LOW / Lowe's Companies, Inc. | 0.01 | -10.40 | 2.16 | 2.56 | 1.0973 | -0.1314 | |||
| APP / AppLovin Corporation | 0.03 | 2.14 | 1.0843 | 1.0843 | |||||
| SPY / SPDR S&P 500 ETF | 0.00 | -1.61 | 2.11 | 8.32 | 1.0696 | -0.0648 | |||
| GOOGL / Alphabet Inc. | 0.01 | -8.39 | 2.08 | -1.00 | 1.0556 | -0.1691 | |||
| CB / Chubb Limited | 0.01 | 0.62 | 2.07 | 15.38 | 1.0495 | 0.0048 | |||
| RTX / RTX Corporation | 0.02 | 2.26 | 2.02 | 18.58 | 1.0225 | 0.0319 | |||
| BSX / Boston Scientific Corporation | 0.03 | -3.54 | 1.91 | 14.26 | 0.9671 | -0.0048 | |||
| BKNG / Booking Holdings Inc. | 0.00 | 2.67 | 1.81 | 4.98 | 0.9195 | -0.0861 | |||
| UNH / UnitedHealth Group Incorporated | 0.00 | -45.01 | 1.80 | -48.32 | 0.9130 | -1.1161 | |||
| PANW / Palo Alto Networks, Inc. | 0.01 | 1.80 | 0.9109 | 0.9109 | |||||
| HIG / The Hartford Insurance Group, Inc. | 0.02 | 1.79 | 0.9073 | 0.9073 | |||||
| COST / Costco Wholesale Corporation | 0.00 | -13.64 | 1.74 | -4.12 | 0.8842 | -0.1751 | |||
| AKAM / Akamai Technologies, Inc. | 0.02 | 0.86 | 1.74 | -7.29 | 0.8836 | -0.2112 | |||
| ABNB / Airbnb, Inc. | 0.01 | 19.00 | 1.71 | 44.25 | 0.8646 | 0.1760 | |||
| ETN / Eaton Corporation plc | 0.01 | -9.62 | 1.69 | 17.34 | 0.8579 | 0.0184 | |||
| LPLA / LPL Financial Holdings Inc. | 0.01 | 2.90 | 1.56 | 19.39 | 0.7901 | 0.0304 | |||
| GE / General Electric Company | 0.01 | 1.95 | 1.52 | 40.28 | 0.7715 | 0.1396 | |||
| IVV / iShares Trust - iShares Core S&P 500 ETF | 0.00 | -4.05 | 1.41 | 5.63 | 0.7139 | -0.0624 | |||
| ING / ING Groep N.V. - Depositary Receipt (Common Stock) | 0.07 | 0.00 | 1.22 | 9.75 | 0.6169 | -0.0284 | |||
| XLF / The Select Sector SPDR Trust - The Financial Select Sector SPDR Fund | 0.03 | -7.37 | 1.11 | 3.76 | 0.5605 | -0.0599 | |||
| MS / Morgan Stanley | 0.01 | 1.44 | 1.09 | 2.45 | 0.5513 | -0.0668 | |||
| CE / Celanese Corporation | 0.01 | 0.97 | 0.4926 | 0.4926 | |||||
| TFC / Truist Financial Corporation | 0.02 | 0.16 | 0.90 | 5.79 | 0.4537 | -0.0390 | |||
| BA / The Boeing Company | 0.00 | -2.61 | 0.80 | -27.96 | 0.4080 | -0.2419 | |||
| VST / Vistra Corp. | 0.01 | -49.80 | 0.65 | -9.21 | 0.3300 | -0.0875 | |||
| XOM / Exxon Mobil Corporation | 0.01 | -2.04 | 0.63 | 14.05 | 0.3168 | -0.0026 | |||
| CVX / Chevron Corporation | 0.00 | 2.55 | 0.61 | 8.29 | 0.3117 | -0.0184 | |||
| C / Citigroup Inc. | 0.01 | -24.05 | 0.58 | -6.61 | 0.2938 | -0.0675 | |||
| EQH / Equitable Holdings, Inc. | 0.01 | 19.92 | 0.55 | 36.84 | 0.2771 | 0.0446 | |||
| CNC / Centene Corporation | 0.01 | 0.54 | 0.2742 | 0.2742 | |||||
| IWM / iShares Trust - iShares Russell 2000 ETF | 0.00 | 23.92 | 0.50 | 30.13 | 0.2540 | 0.0293 | |||
| JPM / JPMorgan Chase & Co. | 0.00 | 29.32 | 0.48 | 52.24 | 0.2409 | 0.0592 | |||
| NSC / Norfolk Southern Corporation | 0.00 | -1.27 | 0.48 | 6.50 | 0.2408 | -0.0190 | |||
| PKST / Peakstone Realty Trust | 0.03 | -2.76 | 0.40 | -21.40 | 0.2052 | -0.0942 | |||
| VTWO / Vanguard Scottsdale Funds - Vanguard Russell 2000 ETF | 0.00 | 0.00 | 0.39 | 4.90 | 0.1952 | -0.0185 | |||
| NKE / NIKE, Inc. | 0.00 | -30.12 | 0.37 | -39.48 | 0.1897 | -0.1705 | |||
| BP / BP p.l.c. - Depositary Receipt (Common Stock) | 0.01 | 0.00 | 0.37 | 6.30 | 0.1885 | -0.0149 | |||
| GJR / Strats Trust For Procter & Gambel Security - Preferred Security | 0.00 | 5.09 | 0.34 | 16.15 | 0.1716 | 0.0022 | |||
| MRK / Merck & Co., Inc. | 0.00 | 21.20 | 0.33 | 46.49 | 0.1698 | 0.0369 | |||
| TSLA / Tesla, Inc. | 0.00 | -13.22 | 0.33 | -38.73 | 0.1673 | -0.1456 | |||
| INTC / Intel Corporation | 0.01 | -6.23 | 0.31 | -17.68 | 0.1584 | -0.0623 | |||
| VOYA / Voya Financial, Inc. | 0.00 | 0.00 | 0.28 | 1.08 | 0.1424 | -0.0190 | |||
| PLTR / Palantir Technologies Inc. | 0.01 | 0.27 | 0.1392 | 0.1392 | |||||
| XLC / The Select Sector SPDR Trust - The Communication Services Select Sector SPDR Fund | 0.00 | 0.00 | 0.27 | 12.35 | 0.1385 | -0.0030 | |||
| GEHC / GE HealthCare Technologies Inc. | 0.00 | 0.31 | 0.26 | 17.86 | 0.1341 | 0.0035 | |||
| SPYG / SPDR Series Trust - SPDR Portfolio S&P 500 Growth ETF | 0.00 | -10.60 | 0.26 | 0.77 | 0.1335 | -0.0190 | |||
| IBM / International Business Machines Corporation | 0.00 | 0.26 | 0.1313 | 0.1313 | |||||
| CELH / Celsius Holdings, Inc. | 0.00 | 0.24 | 0.1192 | 0.1192 | |||||
| VGT / Vanguard World Fund - Vanguard Information Technology ETF | 0.00 | -5.62 | 0.22 | 2.33 | 0.1116 | -0.0137 | |||
| IWD / iShares Trust - iShares Russell 1000 Value ETF | 0.00 | 0.21 | 0.1080 | 0.1080 | |||||
| IBB / iShares Trust - iShares Biotechnology ETF | 0.00 | -3.22 | 0.21 | -2.38 | 0.1044 | -0.0183 | |||
| ITA / iShares Trust - iShares U.S. Aerospace & Defense ETF | 0.00 | -100.00 | 0.00 | 0.0000 | |||||
| SPYV / SPDR Series Trust - SPDR Portfolio S&P 500 Value ETF | 0.00 | -100.00 | 0.00 | 0.0000 | |||||
| ULTA / Ulta Beauty, Inc. | 0.00 | -100.00 | 0.00 | 0.0000 | |||||
| ADBE / Adobe Inc. | 0.00 | -100.00 | 0.00 | 0.0000 | |||||
| LULU / lululemon athletica inc. | 0.00 | -100.00 | 0.00 | 0.0000 | |||||
| SNA / Snap-on Incorporated | 0.00 | -100.00 | 0.00 | 0.0000 | |||||
| EOG / EOG Resources, Inc. | 0.00 | -100.00 | 0.00 | 0.0000 | |||||
| SLB / Schlumberger Limited | 0.00 | -100.00 | 0.00 | 0.0000 |