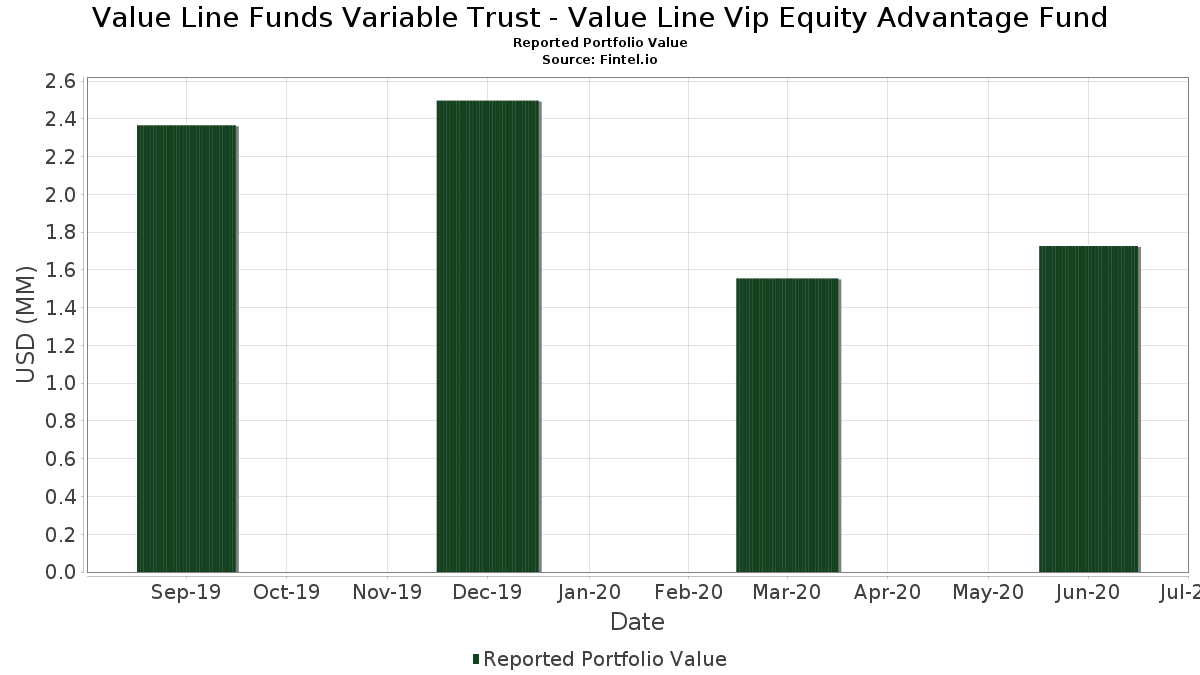
Basic Stats
Portfolio Value $ 1,726,358
Current Positions 36
Latest Holdings, Performance, AUM (from 13F, 13D)

Value Line Funds Variable Trust - Value Line Vip Equity Advantage Fund has disclosed 36 total holdings in their latest SEC filings. Most recent portfolio value is calculated to be $ 1,726,358 USD. Actual Assets Under Management (AUM) is this value plus cash (which is not disclosed). Value Line Funds Variable Trust - Value Line Vip Equity Advantage Fund’s top holdings are State Street Institutional Investment Trust - State Street Institutional US Govt Money Market Fnd Premier Cls (US:GVMXX) , Cohen & Steers, Inc. (US:CNS) , Royce Small-Cap Trust, Inc. (US:RVT) , Nuveen Dow 30 Dynamic Overwrite Fund (US:DIAX) , and abrdn Emerging Markets ex-China Fund, Inc. (US:AEF) . Value Line Funds Variable Trust - Value Line Vip Equity Advantage Fund’s new positions include Eaton Vance Enhanced Equity Income Fund II (US:EOS) , BlackRock Utilities, Infrastructure & Power Opportunities Trust (US:BUI) , Eaton Vance Tax-Managed Diversified Equity Income Fund (US:ETY) , BlackRock Enhanced Equity Dividend Trust (US:BDJ) , and Eaton Vance Risk-Managed Diversified Equity Income Fund (US:ETJ) .

Value Line Funds Variable Trust - Value Line Vip Equity Advantage Fund - Portfolio Value
Top Increases This Quarter

We use the change in the portfolio allocation because this is the most meaningful metric. Changes can be due to trades or changes in share prices.

Security Shares
(MM)
Value
(MM$)
Portfolio % ΔPortfolio %
0.85 0.85 49.8181 36.3043
0.00 0.03 1.7954 1.7954
0.01 0.03 1.5856 1.5856
0.00 0.03 1.5731 1.5731
0.00 0.02 1.3947 1.3947
0.00 0.02 1.3086 1.3086
0.00 0.02 1.2648 1.2648
0.00 0.02 1.1626 1.1626
0.00 0.02 1.1217 1.1217
0.01 0.02 0.9380 0.1766
Top Decreases This Quarter

We use the change in the portfolio allocation because this is the most meaningful metric. Changes can be due to trades or changes in share prices.

Security Shares
(MM)
Value
(MM$)
Portfolio % ΔPortfolio %
0.00 0.03 1.6885 -1.8734
0.00 0.03 1.5523 -1.8171
0.00 0.02 1.4206 -1.6030
0.00 0.03 1.4842 -1.5673
0.00 0.03 1.6267 -1.5317
0.01 0.03 1.5017 -1.4933
0.00 0.03 1.5946 -1.4269
0.00 0.03 1.6579 -1.3913
0.00 0.02 1.4556 -1.3665
0.00 0.03 1.6858 -1.3643
13F and Fund Filings

This form was filed on 2020-08-21 for the reporting period 2020-06-30. Click the link icon to see the full transaction history.

Upgrade to unlock premium data and export to Excel .

2022-07-28: Important Note - We have changed the treatment of the Δ Portfolio % column in this table. Previously, we were reporting it as the percent change in the portfolio allocation. We are now reporting it as the raw change in the portfolio allocation (still reported as a percent). In formula terms, we were previously reporting it as 100 * (current allocation - prior allocation ) / prior allocation. We are now reporting it as (current allocation - prior allocation).
Security Type Avg Share Price Shares
(MM)
ΔShares
(%)
ΔShares
(%)
Value
($MM)
Portfolio
(%)
ΔPortfolio
(%)
GVMXX / State Street Institutional Investment Trust - State Street Institutional US Govt Money Market Fnd Premier Cls 0.85 312.74 0.85 314.15 49.8181 36.3043
CNS / Cohen & Steers, Inc. 0.00 -41.67 0.03 -30.23 1.7954 1.7954
RVT / Royce Small-Cap Trust, Inc. 0.00 -47.83 0.03 -31.82 1.7656 -1.1561
DIAX / Nuveen Dow 30 Dynamic Overwrite Fund 0.00 -35.29 0.03 -30.95 1.7565 -1.0394
AEF / abrdn Emerging Markets ex-China Fund, Inc. 0.00 -35.14 0.03 -23.68 1.7036 -0.8141
HTD / John Hancock Tax-Advantaged Dividend Income Fund 0.00 -37.50 0.03 -33.33 1.6948 -1.0780
XETWX / Eaton Vance Tax-Managed Global 0.00 -54.12 0.03 -48.15 1.6885 -1.8734
HQL / Abrdn Life Sciences Investors 0.00 -48.39 0.03 -39.13 1.6858 -1.3643
ETG / Eaton Vance Tax-Advantaged Global Dividend Income Fund 0.00 -42.86 0.03 -31.71 1.6754 -1.0717
BOE / BlackRock Enhanced Global Dividend Trust 0.00 -46.43 0.03 -39.13 1.6579 -1.3913
SPXX / Nuveen S&P 500 Dynamic Overwrite Fund 0.00 -42.11 0.03 -36.36 1.6571 -1.2331
GDV / The Gabelli Dividend & Income Trust 0.00 -46.67 0.03 -36.36 1.6520 -1.2662
HQH / Abrdn Healthcare Investors 0.00 -51.85 0.03 -43.75 1.6267 -1.5317
BGY / BlackRock Enhanced International Dividend Trust 0.01 -47.00 0.03 -40.00 1.5981 -1.3575
TY / Tri-Continental Corporation 0.00 -50.00 0.03 -41.30 1.5946 -1.4269
UNH / UnitedHealth Group Incorporated 0.01 -42.00 0.03 -35.71 1.5856 1.5856
US2782651036 / Eaton Vance Corp. 0.00 -48.33 0.03 -40.91 1.5731 1.5731
QQQX / Nuveen Nasdaq 100 Dynamic Overwrite Fund 0.00 -57.41 0.03 -49.02 1.5523 -1.8171
UTF / Cohen & Steers Infrastructure Fund, Inc 0.00 -47.83 0.03 -39.53 1.5523 -1.2954
BCX / Blackrock Resources & Commodities Strategy Trust 0.00 -46.25 0.03 -35.00 1.5463 -1.1019
PEO / Adams Natural Resources Fund, Inc. 0.00 -43.90 0.03 -21.21 1.5328 -0.6997
IGD / Voya Global Equity Dividend and Premium Opportunity Fund 0.01 -47.00 0.03 -44.44 1.5017 -1.4933
CAF / Morgan Stanley China A Share Fund, Inc. 0.00 -43.48 0.03 -39.02 1.4879 -1.2494
BXMX / Nuveen S&P 500 Buy-Write Income Fund 0.00 -50.00 0.03 -45.65 1.4842 -1.5673
BTG / B2Gold Corp. 0.00 -50.00 0.03 -37.50 1.4810 -1.1691
SOR / Source Capital 0.00 -46.43 0.02 -42.86 1.4556 -1.3665
XTDFX / Templeton Dragon Fund, Inc. 0.00 -55.56 0.02 -47.83 1.4206 -1.6030
EOS / Eaton Vance Enhanced Equity Income Fund II 0.00 0.02 1.3947 1.3947
BUI / BlackRock Utilities, Infrastructure & Power Opportunities Trust 0.00 0.02 1.3086 1.3086
ETY / Eaton Vance Tax-Managed Diversified Equity Income Fund 0.00 0.02 1.2648 1.2648
BDJ / BlackRock Enhanced Equity Dividend Trust 0.00 0.02 1.1626 1.1626
ETJ / Eaton Vance Risk-Managed Diversified Equity Income Fund 0.00 0.02 1.1217 1.1217
NML / Neuberger Berman Energy Infrastructure and Income Fund Inc. 0.01 -25.00 0.02 13.33 1.0348 0.0417
CTR / ClearBridge MLP and Midstream Total Return Fund Inc. 0.01 -29.76 0.02 36.36 0.9380 0.1766
KYN / Kayne Anderson Energy Infrastructure Fund, Inc. 0.00 -33.33 0.02 -6.25 0.9292 -0.1437
US38147W1036 / Goldman Sachs MLP Income Opportunities Fund 0.00 -89.72 0.01 -18.18 0.5777 -0.1842