Basic Stats
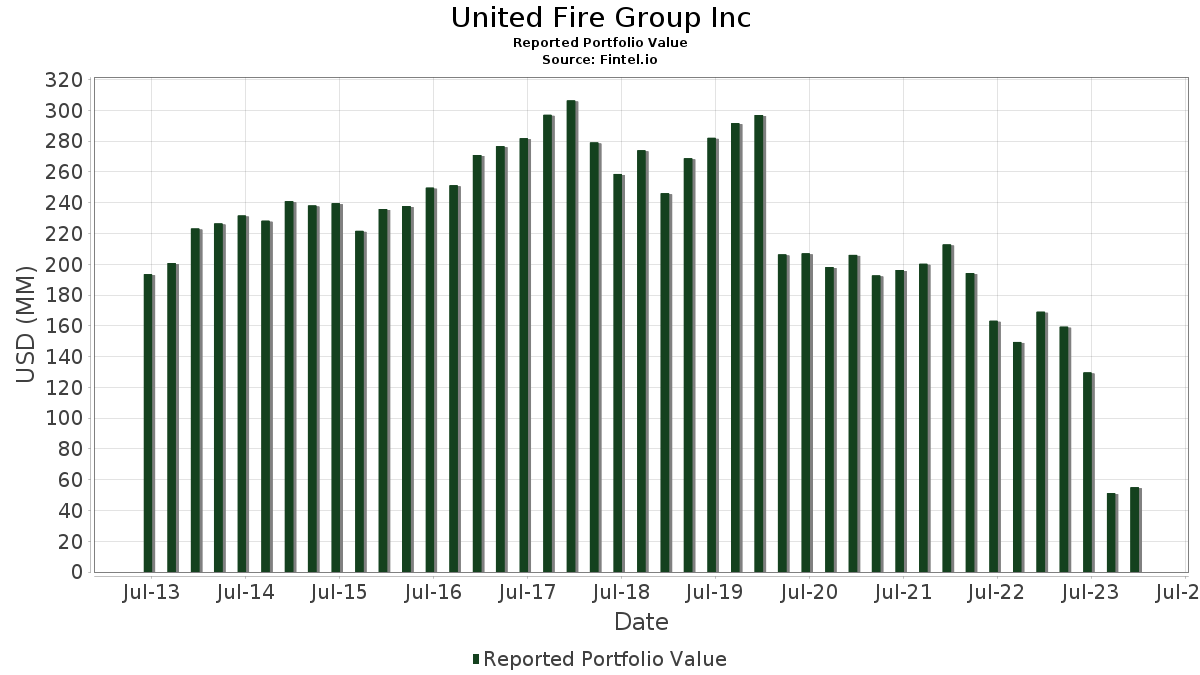
| Portfolio Value | $ 55,018,679 |
| Current Positions | 21 |
Latest Holdings, Performance, AUM (from 13F, 13D)
United Fire Group Inc has disclosed 21 total holdings in their latest SEC filings. Most recent portfolio value is calculated to be $ 55,018,679 USD. Actual Assets Under Management (AUM) is this value plus cash (which is not disclosed). United Fire Group Inc’s top holdings are Enterprise Products Partners L.P. - Limited Partnership (US:EPD) , Strats Trust For Procter & Gambel Security - Preferred Security (US:GJR) , Union Pacific Corporation (US:UNP) , Microsoft Corporation (US:MSFT) , and NIKE, Inc. (US:NKE) . United Fire Group Inc’s new positions include Dow Inc. (US:DOW) , .
Top Increases This Quarter
We use the change in the portfolio allocation because this is the most meaningful metric. Changes can be due to trades or changes in share prices.
| Security | Shares (MM) |
Value (MM$) |
Portfolio % | ΔPortfolio % |
|---|---|---|---|---|
| 0.02 | 5.53 | 10.0447 | 1.0990 | |
| 0.01 | 3.76 | 6.8348 | 0.6698 | |
| 0.03 | 2.55 | 4.6398 | 0.5826 | |
| 0.03 | 1.33 | 2.4130 | 0.4330 | |
| 0.03 | 3.26 | 5.9200 | 0.3191 | |
| 0.01 | 1.70 | 3.0917 | 0.2602 | |
| 0.02 | 1.86 | 3.3898 | 0.2006 | |
| 0.02 | 1.94 | 3.5275 | 0.0810 | |
| 0.07 | 2.63 | 4.7733 | 0.0485 | |
| 0.01 | 2.64 | 4.8063 | 0.0137 |
Top Decreases This Quarter
We use the change in the portfolio allocation because this is the most meaningful metric. Changes can be due to trades or changes in share prices.
| Security | Shares (MM) |
Value (MM$) |
Portfolio % | ΔPortfolio % |
|---|---|---|---|---|
| 0.26 | 6.85 | 12.4521 | -1.4421 | |
| 0.04 | 5.76 | 10.4674 | -0.7248 | |
| 0.04 | 1.30 | 2.3547 | -0.5596 | |
| 0.04 | 1.92 | 3.4839 | -0.5117 | |
| 0.03 | 2.07 | 3.7612 | -0.1563 | |
| 0.03 | 2.06 | 3.7433 | -0.0816 | |
| 0.01 | 1.07 | 1.9525 | -0.0649 | |
| 0.16 | 1.54 | 2.8059 | -0.0582 | |
| 0.04 | 2.05 | 3.7296 | -0.0543 |
13F and Fund Filings
This form was filed on 2024-02-13 for the reporting period 2023-12-31. Click the link icon to see the full transaction history.
Upgrade to unlock premium data and export to Excel ![]() .
.
| Security | Type | Avg Share Price | Shares (MM) |
ΔShares (%) |
ΔShares (%) |
Value ($MM) |
Portfolio (%) |
ΔPortfolio (%) |
|
|---|---|---|---|---|---|---|---|---|---|
| EPD / Enterprise Products Partners L.P. - Limited Partnership | 0.26 | 0.00 | 6.85 | -3.72 | 12.4521 | -1.4421 | |||
| GJR / Strats Trust For Procter & Gambel Security - Preferred Security | 0.04 | 0.00 | 5.76 | 0.47 | 10.4674 | -0.7248 | |||
| UNP / Union Pacific Corporation | 0.02 | 0.00 | 5.53 | 20.63 | 10.0447 | 1.0990 | |||
| MSFT / Microsoft Corporation | 0.01 | 0.00 | 3.76 | 19.10 | 6.8348 | 0.6698 | |||
| NKE / NIKE, Inc. | 0.03 | 0.00 | 3.26 | 13.56 | 5.9200 | 0.3191 | |||
| DOW / Dow Inc. | 0.06 | 3.11 | 0.0000 | ||||||
| MA / Mastercard Incorporated | 0.01 | 0.00 | 2.64 | 7.74 | 4.8063 | 0.0137 | |||
| EBGEF / Enbridge Inc. - Preferred Stock | 0.07 | 0.00 | 2.63 | 8.56 | 4.7733 | 0.0485 | |||
| WTFC / Wintrust Financial Corporation | 0.03 | 0.00 | 2.55 | 22.87 | 4.6398 | 0.5826 | |||
| DD / DuPont de Nemours, Inc. | 0.03 | 0.00 | 2.07 | 3.14 | 3.7612 | -0.1563 | |||
| MDT / Medtronic plc | 0.03 | 0.00 | 2.06 | 5.10 | 3.7433 | -0.0816 | |||
| LNT / Alliant Energy Corporation | 0.04 | 0.00 | 2.05 | 5.88 | 3.7296 | -0.0543 | |||
| DUK / Duke Energy Corporation | 0.02 | 0.00 | 1.94 | 9.92 | 3.5275 | 0.0810 | |||
| CTVA / Corteva, Inc. | 0.04 | 0.00 | 1.92 | -6.35 | 3.4839 | -0.5117 | |||
| MS / Morgan Stanley | 0.02 | 0.00 | 1.86 | 14.21 | 3.3898 | 0.2006 | |||
| JPM / JPMorgan Chase & Co. | 0.01 | 0.00 | 1.70 | 17.31 | 3.0917 | 0.2602 | |||
| AMCR / Amcor plc | 0.16 | 0.00 | 1.54 | 5.25 | 2.8059 | -0.0582 | |||
| USB / U.S. Bancorp | 0.03 | 0.00 | 1.33 | 30.87 | 2.4130 | 0.4330 | |||
| PFE / Pfizer Inc. | 0.04 | 0.00 | 1.30 | -13.20 | 2.3547 | -0.5596 | |||
| ABBV / AbbVie Inc. | 0.01 | 0.00 | 1.07 | 3.97 | 1.9525 | -0.0649 | |||
| ORI / Old Republic International Corporation | 0.00 | 0.00 | 0.09 | 10.00 | 0.1603 | 0.0025 |