Basic Stats
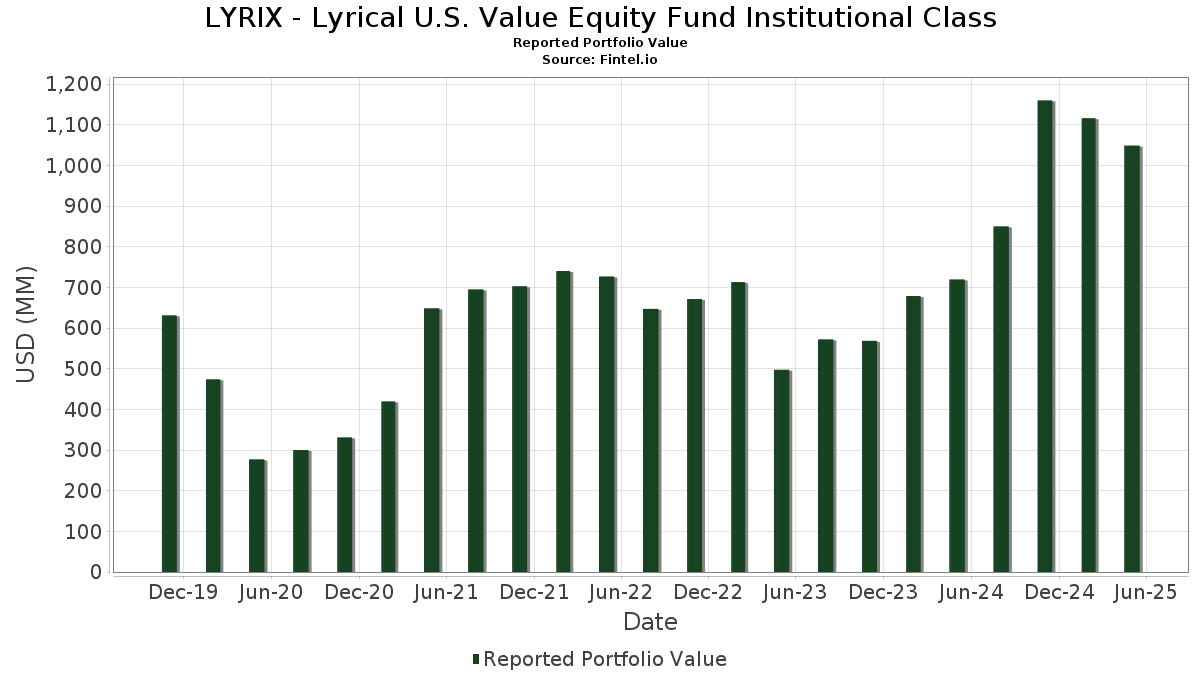
| Portfolio Value | $ 1,048,346,685 |
| Current Positions | 34 |
Latest Holdings, Performance, AUM (from 13F, 13D)
LYRIX - Lyrical U.S. Value Equity Fund Institutional Class has disclosed 34 total holdings in their latest SEC filings. Most recent portfolio value is calculated to be $ 1,048,346,685 USD. Actual Assets Under Management (AUM) is this value plus cash (which is not disclosed). LYRIX - Lyrical U.S. Value Equity Fund Institutional Class’s top holdings are NRG Energy, Inc. (US:NRG) , United Rentals, Inc. (US:URI) , Johnson Controls International plc (US:JCI) , Uber Technologies, Inc. (US:UBER) , and Fidelity National Information Services, Inc. (US:FIS) . LYRIX - Lyrical U.S. Value Equity Fund Institutional Class’s new positions include LKQ Corporation (US:LKQ) , Amcor plc (US:AMCR) , Invesco Treasury Portfolio, Institutional Class (US:US8252524066) , .
Top Increases This Quarter
We use the change in the portfolio allocation because this is the most meaningful metric. Changes can be due to trades or changes in share prices.
| Security | Shares (MM) |
Value (MM$) |
Portfolio % | ΔPortfolio % |
|---|---|---|---|---|
| 0.55 | 22.12 | 2.1097 | 2.1097 | |
| 0.48 | 75.10 | 7.1631 | 1.9869 | |
| 2.01 | 18.28 | 1.7438 | 1.7438 | |
| 0.56 | 57.22 | 5.4581 | 0.5556 | |
| 0.10 | 39.29 | 3.7476 | 0.5530 | |
| 0.65 | 47.62 | 4.5418 | 0.2700 | |
| 0.63 | 50.52 | 4.8186 | 0.2329 | |
| 0.39 | 44.79 | 4.2720 | 0.2274 | |
| 0.09 | 60.22 | 5.7442 | 0.1931 | |
| 0.99 | 41.75 | 3.9823 | 0.1920 |
Top Decreases This Quarter
We use the change in the portfolio allocation because this is the most meaningful metric. Changes can be due to trades or changes in share prices.
| Security | Shares (MM) |
Value (MM$) |
Portfolio % | ΔPortfolio % |
|---|---|---|---|---|
| 0.26 | 43.93 | 4.1899 | -1.0883 | |
| 0.32 | 24.46 | 2.3326 | -1.0572 | |
| 0.14 | 46.48 | 4.4329 | -0.8889 | |
| 1.08 | 38.56 | 3.6777 | -0.5186 | |
| 0.09 | 44.85 | 4.2780 | -0.5152 | |
| 0.15 | 17.99 | 1.7157 | -0.3302 | |
| 0.12 | 35.34 | 3.3706 | -0.2959 | |
| 0.09 | 11.62 | 1.1079 | -0.2746 | |
| 0.07 | 20.03 | 1.9101 | -0.2656 | |
| 0.06 | 17.69 | 1.6877 | -0.2536 |
13F and Fund Filings
This form was filed on 2025-07-29 for the reporting period 2025-05-31. Click the link icon to see the full transaction history.
Upgrade to unlock premium data and export to Excel ![]() .
.
| Security | Type | Avg Share Price | Shares (MM) |
ΔShares (%) |
ΔShares (%) |
Value ($MM) |
Portfolio (%) |
ΔPortfolio (%) |
|
|---|---|---|---|---|---|---|---|---|---|
| NRG / NRG Energy, Inc. | 0.48 | -11.80 | 75.10 | 30.08 | 7.1631 | 1.9869 | |||
| URI / United Rentals, Inc. | 0.09 | -11.81 | 60.22 | -2.74 | 5.7442 | 0.1931 | |||
| JCI / Johnson Controls International plc | 0.56 | -11.57 | 57.22 | 4.65 | 5.4581 | 0.5556 | |||
| UBER / Uber Technologies, Inc. | 0.62 | -11.69 | 51.89 | -2.22 | 4.9494 | 0.1915 | |||
| FIS / Fidelity National Information Services, Inc. | 0.63 | -11.77 | 50.52 | -1.23 | 4.8186 | 0.2329 | |||
| EBAY / eBay Inc. | 0.65 | -11.58 | 47.62 | -0.07 | 4.5418 | 0.2700 | |||
| CPAY / Corpay, Inc. | 0.14 | -11.60 | 46.48 | -21.71 | 4.4329 | -0.8889 | |||
| AMP / Ameriprise Financial, Inc. | 0.09 | -11.49 | 44.85 | -16.11 | 4.2780 | -0.5152 | |||
| AER / AerCap Holdings N.V. | 0.39 | -11.56 | 44.79 | -0.72 | 4.2720 | 0.2274 | |||
| EXPE / Expedia Group, Inc. | 0.26 | -11.42 | 43.93 | -25.39 | 4.1899 | -1.0883 | |||
| FLEX / Flex Ltd. | 0.99 | -11.54 | 41.75 | -1.24 | 3.9823 | 0.1920 | |||
| HCA / HCA Healthcare, Inc. | 0.10 | -11.44 | 39.29 | 10.27 | 3.7476 | 0.5530 | |||
| SU / Suncor Energy Inc. | 1.08 | -11.30 | 38.56 | -17.62 | 3.6777 | -0.5186 | |||
| FFIV / F5, Inc. | 0.12 | -11.46 | 35.34 | -13.59 | 3.3706 | -0.2959 | |||
| CI / The Cigna Group | 0.11 | -11.57 | 35.25 | -9.34 | 3.3626 | -0.1235 | |||
| GEN / Gen Digital Inc. | 1.20 | -11.37 | 34.05 | -7.64 | 3.2482 | -0.0574 | |||
| CNC / Centene Corporation | 0.45 | -10.93 | 25.16 | -13.57 | 2.3998 | -0.2099 | |||
| GPN / Global Payments Inc. | 0.32 | -9.94 | 24.46 | -35.32 | 2.3326 | -1.0572 | |||
| AIZ / Assurant, Inc. | 0.12 | -11.63 | 24.05 | -13.72 | 2.2943 | -0.2051 | |||
| LKQ / LKQ Corporation | 0.55 | 22.12 | 2.1097 | 2.1097 | |||||
| PRI / Primerica, Inc. | 0.07 | -11.57 | 20.03 | -17.48 | 1.9101 | -0.2656 | |||
| AMCR / Amcor plc | 2.01 | 18.28 | 1.7438 | 1.7438 | |||||
| SNX / TD SYNNEX Corporation | 0.15 | -10.68 | 17.99 | -21.18 | 1.7157 | -0.3302 | |||
| HSIC / Henry Schein, Inc. | 0.26 | -11.26 | 17.92 | -13.94 | 1.7093 | -0.1576 | |||
| US8252524066 / Invesco Treasury Portfolio, Institutional Class | 17.80 | -1.50 | 1.6982 | 0.0777 | |||||
| LAD / Lithia Motors, Inc. | 0.06 | -11.19 | 17.69 | -18.28 | 1.6877 | -0.2536 | |||
| WCC / WESCO International, Inc. | 0.10 | -11.36 | 17.56 | -17.54 | 1.6748 | -0.2342 | |||
| ARW / Arrow Electronics, Inc. | 0.14 | -11.87 | 16.98 | -3.46 | 1.6200 | 0.0427 | |||
| AMG / Affiliated Managers Group, Inc. | 0.09 | -11.86 | 15.05 | -9.20 | 1.4360 | -0.0506 | |||
| AL / Air Lease Corporation | 0.25 | -11.63 | 14.13 | 6.24 | 1.3476 | 0.1554 | |||
| WEX / WEX Inc. | 0.09 | -10.98 | 11.62 | -24.67 | 1.1079 | -0.2746 | |||
| LEA / Lear Corporation | 0.12 | -11.51 | 11.07 | -14.88 | 1.0562 | -0.1100 | |||
| CNXC / Concentrix Corporation | 0.12 | -11.26 | 6.66 | 9.96 | 0.6350 | 0.0922 | |||
| ADNT / Adient plc | 0.19 | -10.93 | 2.91 | -12.29 | 0.2772 | -0.0198 |