Basic Stats
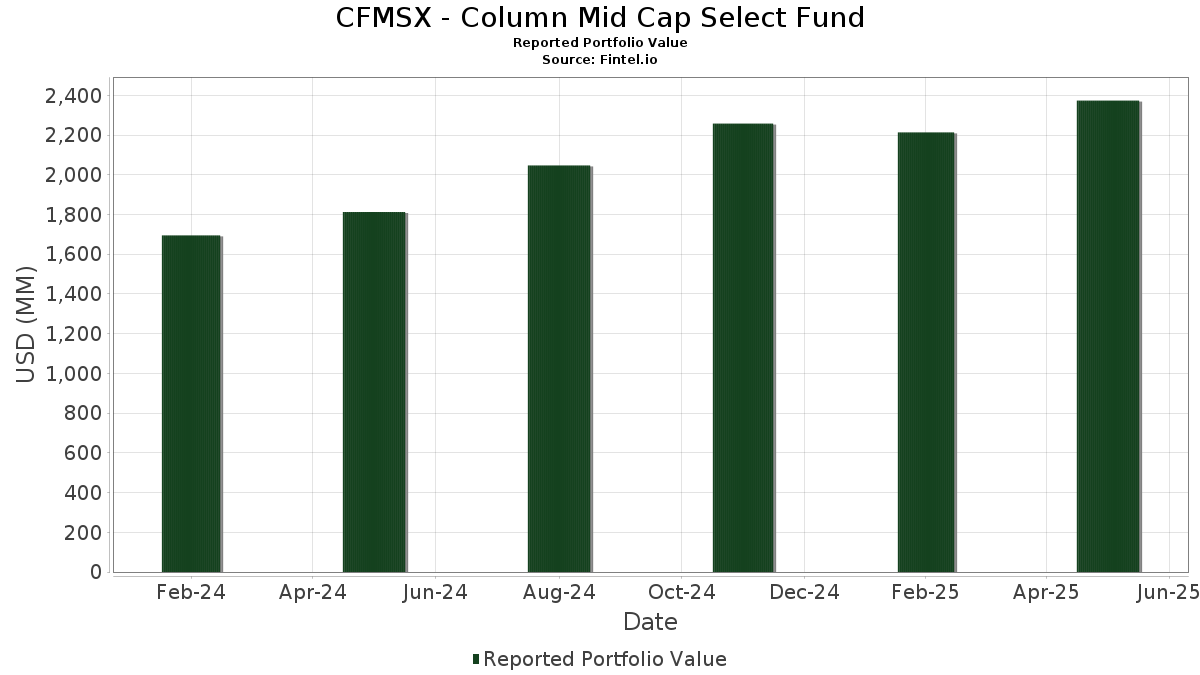
| Portfolio Value | $ 2,373,525,439 |
| Current Positions | 199 |
Latest Holdings, Performance, AUM (from 13F, 13D)
CFMSX - Column Mid Cap Select Fund has disclosed 199 total holdings in their latest SEC filings. Most recent portfolio value is calculated to be $ 2,373,525,439 USD. Actual Assets Under Management (AUM) is this value plus cash (which is not disclosed). CFMSX - Column Mid Cap Select Fund’s top holdings are First American Funds Inc - First American Government Obligations Fund Class X (US:FGXXX) , AMETEK, Inc. (US:AME) , Houlihan Lokey, Inc. (US:HLI) , LPL Financial Holdings Inc. (US:LPLA) , and Heico Corp. - Class A (US:HEIA) . CFMSX - Column Mid Cap Select Fund’s new positions include EMCOR Group, Inc. (US:EME) , Tenet Healthcare Corporation (US:THC) , TechnipFMC plc (US:FTI) , Jabil Inc. (US:JBL) , and CACI International Inc (US:CACI) .
Top Increases This Quarter
We use the change in the portfolio allocation because this is the most meaningful metric. Changes can be due to trades or changes in share prices.
| Security | Shares (MM) |
Value (MM$) |
Portfolio % | ΔPortfolio % |
|---|---|---|---|---|
| 0.04 | 17.05 | 0.7240 | 0.7240 | |
| 0.16 | 23.13 | 0.9823 | 0.3583 | |
| 0.04 | 7.50 | 0.3186 | 0.3186 | |
| 0.21 | 6.66 | 0.2829 | 0.2829 | |
| 0.04 | 6.38 | 0.2708 | 0.2708 | |
| 0.04 | 17.43 | 0.7403 | 0.2634 | |
| 0.12 | 21.64 | 0.9189 | 0.2540 | |
| 0.36 | 16.41 | 0.6967 | 0.2443 | |
| 0.36 | 16.41 | 0.6967 | 0.2443 | |
| 0.21 | 14.23 | 0.6045 | 0.2335 |
Top Decreases This Quarter
We use the change in the portfolio allocation because this is the most meaningful metric. Changes can be due to trades or changes in share prices.
| Security | Shares (MM) |
Value (MM$) |
Portfolio % | ΔPortfolio % |
|---|---|---|---|---|
| 0.04 | 19.90 | 0.8449 | -0.6455 | |
| 0.28 | 39.74 | 1.6878 | -0.3119 | |
| 0.19 | 21.05 | 0.8939 | -0.3054 | |
| 0.32 | 21.69 | 0.9212 | -0.2983 | |
| 0.18 | 22.89 | 0.9721 | -0.2643 | |
| 0.18 | 6.99 | 0.2970 | -0.2285 | |
| 0.05 | 14.28 | 0.6066 | -0.2267 | |
| 0.09 | 24.36 | 1.0345 | -0.1841 | |
| 0.20 | 14.58 | 0.6191 | -0.1655 | |
| 0.05 | 3.90 | 0.1656 | -0.1553 |
13F and Fund Filings
This form was filed on 2025-07-23 for the reporting period 2025-05-31. Click the link icon to see the full transaction history.
Upgrade to unlock premium data and export to Excel ![]() .
.
| Security | Type | Avg Share Price | Shares (MM) |
ΔShares (%) |
ΔShares (%) |
Value ($MM) |
Portfolio (%) |
ΔPortfolio (%) |
|
|---|---|---|---|---|---|---|---|---|---|
| FGXXX / First American Funds Inc - First American Government Obligations Fund Class X | 64.35 | 0.74 | 64.35 | 0.74 | 2.7326 | -0.1494 | |||
| AME / AMETEK, Inc. | 0.28 | 5.89 | 50.78 | -0.01 | 2.1563 | -0.1351 | |||
| HLI / Houlihan Lokey, Inc. | 0.29 | 6.44 | 50.18 | 7.26 | 2.1309 | 0.0200 | |||
| LPLA / LPL Financial Holdings Inc. | 0.12 | 9.40 | 47.92 | 13.93 | 2.0351 | 0.1372 | |||
| HEIA / Heico Corp. - Class A | 0.17 | 10.53 | 40.26 | 22.29 | 1.7096 | 0.2243 | |||
| ROST / Ross Stores, Inc. | 0.28 | -10.17 | 39.74 | -10.32 | 1.6878 | -0.3119 | |||
| BR / Broadridge Financial Solutions, Inc. | 0.15 | 8.23 | 37.51 | 8.95 | 1.5931 | 0.0394 | |||
| EFX / Equifax Inc. | 0.14 | 7.57 | 37.24 | 15.90 | 1.5815 | 0.1317 | |||
| TDY / Teledyne Technologies Incorporated | 0.07 | 7.11 | 33.68 | 3.75 | 1.4301 | -0.0345 | |||
| WAB / Westinghouse Air Brake Technologies Corporation | 0.16 | 8.09 | 32.71 | 17.98 | 1.3890 | 0.1380 | |||
| MPWR / Monolithic Power Systems, Inc. | 0.05 | 8.10 | 30.12 | 17.11 | 1.2791 | 0.1186 | |||
| ALLE / Allegion plc | 0.21 | 5.70 | 29.98 | 17.19 | 1.2730 | 0.1188 | |||
| MAS / Masco Corporation | 0.42 | 14.89 | 26.31 | -4.61 | 1.1171 | -0.1272 | |||
| COR / Cencora, Inc. | 0.09 | -17.09 | 25.91 | -4.77 | 1.1002 | -0.1273 | |||
| PNR / Pentair plc | 0.26 | 7.88 | 25.77 | 13.58 | 1.0944 | 0.0706 | |||
| KEYS / Keysight Technologies, Inc. | 0.16 | 11.82 | 24.94 | 10.08 | 1.0593 | 0.0368 | |||
| VRSK / Verisk Analytics, Inc. | 0.08 | 1.86 | 24.36 | 7.78 | 1.0347 | 0.0146 | |||
| RSG / Republic Services, Inc. | 0.09 | -16.91 | 24.36 | -9.80 | 1.0345 | -0.1841 | |||
| BSY / Bentley Systems, Incorporated | 0.49 | 7.03 | 23.48 | 16.37 | 0.9973 | 0.0867 | |||
| WST / West Pharmaceutical Services, Inc. | 0.11 | 45.19 | 23.26 | 31.77 | 0.9879 | 0.1913 | |||
| DRI / Darden Restaurants, Inc. | 0.11 | -5.41 | 23.22 | 1.08 | 0.9860 | -0.0505 | |||
| ICE / Intercontinental Exchange, Inc. | 0.13 | 9.67 | 23.17 | 13.83 | 0.9841 | 0.0655 | |||
| HLNE / Hamilton Lane Incorporated | 0.16 | 75.47 | 23.13 | 67.25 | 0.9823 | 0.3583 | |||
| CBRE / CBRE Group, Inc. | 0.18 | -5.15 | 22.89 | -16.46 | 0.9721 | -0.2643 | |||
| DPZ / Domino's Pizza, Inc. | 0.05 | 8.79 | 22.65 | 5.26 | 0.9619 | -0.0091 | |||
| POOL / Pool Corporation | 0.07 | 7.96 | 22.33 | -6.48 | 0.9482 | -0.1291 | |||
| COO / The Cooper Companies, Inc. | 0.32 | 6.24 | 21.69 | -19.74 | 0.9212 | -0.2983 | |||
| ALGN / Align Technology, Inc. | 0.12 | 51.77 | 21.64 | 46.83 | 0.9189 | 0.2540 | |||
| SF / Stifel Financial Corp. | 0.23 | 28.85 | 21.37 | 14.32 | 0.9075 | 0.0641 | |||
| AL / Air Lease Corporation | 0.37 | 9.67 | 21.26 | 31.84 | 0.9029 | 0.1753 | |||
| BRO / Brown & Brown, Inc. | 0.19 | -16.85 | 21.05 | -20.81 | 0.8939 | -0.3054 | |||
| RJF / Raymond James Financial, Inc. | 0.14 | 9.67 | 20.98 | 4.22 | 0.8910 | -0.0174 | |||
| NDSN / Nordson Corporation | 0.10 | 6.39 | 20.39 | 7.25 | 0.8660 | 0.0080 | |||
| WWD / Woodward, Inc. | 0.09 | 9.67 | 20.11 | 25.53 | 0.8541 | 0.1312 | |||
| FDS / FactSet Research Systems Inc. | 0.04 | 5.46 | 20.11 | 4.66 | 0.8539 | -0.0130 | |||
| RGA / Reinsurance Group of America, Incorporated | 0.10 | 9.67 | 20.06 | 9.99 | 0.8517 | 0.0290 | |||
| RNR / RenaissanceRe Holdings Ltd. | 0.08 | 1.20 | 19.94 | 6.23 | 0.8466 | -0.0002 | |||
| LII / Lennox International Inc. | 0.04 | -35.86 | 19.90 | -39.77 | 0.8449 | -0.6455 | |||
| DOV / Dover Corporation | 0.11 | 1.19 | 19.80 | -9.51 | 0.8408 | -0.1465 | |||
| EWBC / East West Bancorp, Inc. | 0.21 | 18.55 | 18.87 | 14.49 | 0.8012 | 0.0577 | |||
| ANSS / ANSYS, Inc. | 0.06 | 9.67 | 18.70 | 8.87 | 0.7942 | 0.0191 | |||
| PKG / Packaging Corporation of America | 0.09 | 8.68 | 18.25 | -1.48 | 0.7752 | -0.0609 | |||
| OLED / Universal Display Corporation | 0.13 | 9.27 | 17.94 | 1.96 | 0.7617 | -0.0320 | |||
| ULTA / Ulta Beauty, Inc. | 0.04 | 28.16 | 17.43 | 64.92 | 0.7403 | 0.2634 | |||
| SYY / Sysco Corporation | 0.24 | 3.40 | 17.24 | -0.08 | 0.7319 | -0.0464 | |||
| EXPO / Exponent, Inc. | 0.22 | 7.16 | 17.06 | -3.37 | 0.7243 | -0.0721 | |||
| EME / EMCOR Group, Inc. | 0.04 | 17.05 | 0.7240 | 0.7240 | |||||
| BXP / Boston Properties, Inc. | 0.25 | 8.59 | 16.98 | 3.08 | 0.7209 | -0.0222 | |||
| HWM / Howmet Aerospace Inc. | 0.10 | -5.95 | 16.47 | 16.97 | 0.6996 | 0.0641 | |||
| SNA / Snap-on Incorporated | 0.05 | 9.67 | 16.42 | 3.11 | 0.6973 | -0.0213 | |||
| QGEN / Qiagen N.V. | 0.36 | 39.23 | 16.41 | 63.63 | 0.6967 | 0.2443 | |||
| QGEN / Qiagen N.V. | 0.36 | 39.23 | 16.41 | 63.63 | 0.6967 | 0.2443 | |||
| WEC / WEC Energy Group, Inc. | 0.15 | 9.67 | 16.25 | 10.44 | 0.6902 | 0.0262 | |||
| ARW / Arrow Electronics, Inc. | 0.14 | 3.23 | 16.05 | 13.08 | 0.6816 | 0.0412 | |||
| AMP / Ameriprise Financial, Inc. | 0.03 | 11.96 | 15.39 | 6.12 | 0.6536 | -0.0008 | |||
| ENTG / Entegris, Inc. | 0.22 | 89.11 | 15.21 | 28.43 | 0.6461 | 0.1116 | |||
| SMG / The Scotts Miracle-Gro Company | 0.25 | 59.54 | 15.14 | 62.24 | 0.6430 | 0.2219 | |||
| DHI / D.R. Horton, Inc. | 0.13 | 9.67 | 14.96 | 2.11 | 0.6355 | -0.0258 | |||
| MSCI / MSCI Inc. | 0.03 | 6.85 | 14.83 | 2.06 | 0.6298 | -0.0259 | |||
| IQV / IQVIA Holdings Inc. | 0.10 | 52.61 | 14.72 | 13.43 | 0.6250 | 0.0395 | |||
| LH / Labcorp Holdings Inc. | 0.06 | 9.67 | 14.61 | 8.77 | 0.6202 | 0.0143 | |||
| WRB / W. R. Berkley Corporation | 0.20 | -29.19 | 14.58 | -16.16 | 0.6191 | -0.1655 | |||
| CMI / Cummins Inc. | 0.04 | 9.67 | 14.46 | -4.24 | 0.6140 | -0.0673 | |||
| PGR / The Progressive Corporation | 0.05 | -23.44 | 14.28 | -22.65 | 0.6066 | -0.2267 | |||
| SWKS / Skyworks Solutions, Inc. | 0.21 | 67.17 | 14.23 | 73.12 | 0.6045 | 0.2335 | |||
| AZO / AutoZone, Inc. | 0.00 | -5.82 | 13.90 | 0.66 | 0.5902 | -0.0328 | |||
| GATX / GATX Corporation | 0.09 | 9.67 | 13.76 | 4.54 | 0.5842 | -0.0095 | |||
| WTFC / Wintrust Financial Corporation | 0.11 | 9.67 | 13.69 | 5.21 | 0.5814 | -0.0057 | |||
| HXL / Hexcel Corporation | 0.26 | 65.36 | 13.65 | 38.02 | 0.5797 | 0.1334 | |||
| CNC / Centene Corporation | 0.23 | 9.67 | 13.07 | 6.43 | 0.5552 | 0.0009 | |||
| CSX / CSX Corporation | 0.41 | 9.67 | 12.90 | 8.23 | 0.5478 | 0.0100 | |||
| ODFL / Old Dominion Freight Line, Inc. | 0.08 | 6.19 | 12.48 | -3.63 | 0.5300 | -0.0544 | |||
| A / Agilent Technologies, Inc. | 0.11 | 9.67 | 12.10 | -4.05 | 0.5137 | -0.0551 | |||
| NSC / Norfolk Southern Corporation | 0.05 | 5.64 | 12.02 | 6.23 | 0.5103 | -0.0001 | |||
| AKAM / Akamai Technologies, Inc. | 0.16 | 9.67 | 11.95 | 3.21 | 0.5073 | -0.0149 | |||
| COG / Cabot Oil & Gas Corp. | 0.49 | 9.67 | 11.92 | -1.23 | 0.5061 | -0.0383 | |||
| SBAC / SBA Communications Corporation | 0.05 | 9.67 | 11.79 | 16.71 | 0.5007 | 0.0449 | |||
| GD / General Dynamics Corporation | 0.04 | 9.67 | 11.78 | 20.92 | 0.5004 | 0.0607 | |||
| TJX / The TJX Companies, Inc. | 0.09 | 9.67 | 11.55 | 11.55 | 0.4905 | 0.0233 | |||
| CHKP / Check Point Software Technologies Ltd. | 0.05 | -14.01 | 10.85 | -10.65 | 0.4608 | -0.0872 | |||
| EMN / Eastman Chemical Company | 0.13 | 9.67 | 10.06 | -12.16 | 0.4272 | -0.0896 | |||
| SPG / Simon Property Group, Inc. | 0.06 | 5.65 | 10.04 | -7.42 | 0.4264 | -0.0630 | |||
| COLD / Americold Realty Trust, Inc. | 0.58 | 9.67 | 9.69 | -20.75 | 0.4114 | -0.1402 | |||
| TXT / Textron Inc. | 0.13 | 5.65 | 9.60 | 4.67 | 0.4078 | -0.0062 | |||
| GPN / Global Payments Inc. | 0.12 | 9.67 | 9.38 | -21.24 | 0.3984 | -0.1390 | |||
| USFD / US Foods Holding Corp. | 0.12 | 31.60 | 9.37 | 45.28 | 0.3978 | 0.1068 | |||
| MKL / Markel Group Inc. | 0.00 | 5.63 | 9.29 | 6.07 | 0.3946 | -0.0006 | |||
| SNPS / Synopsys, Inc. | 0.02 | 9.67 | 9.24 | 11.28 | 0.3923 | 0.0177 | |||
| SGI / Somnigroup International Inc. | 0.14 | 23.51 | 9.04 | 25.80 | 0.3839 | 0.0596 | |||
| ST / Sensata Technologies Holding plc | 0.35 | -13.61 | 9.01 | -21.97 | 0.3824 | -0.1383 | |||
| BIO / Bio-Rad Laboratories, Inc. | 0.04 | 9.67 | 8.92 | -6.14 | 0.3786 | -0.0500 | |||
| DTE / DTE Energy Company | 0.06 | -4.37 | 8.81 | -2.26 | 0.3741 | -0.0326 | |||
| EVR / Evercore Inc. | 0.04 | 17.36 | 8.81 | 12.35 | 0.3739 | 0.0203 | |||
| EBAY / eBay Inc. | 0.12 | 5.67 | 8.76 | 19.43 | 0.3720 | 0.0410 | |||
| RBA / RB Global, Inc. | 0.08 | 5.65 | 8.56 | 8.67 | 0.3637 | 0.0081 | |||
| HBAN / Huntington Bancshares Incorporated | 0.55 | -3.24 | 8.53 | -8.18 | 0.3624 | -0.0569 | |||
| CF / CF Industries Holdings, Inc. | 0.09 | 5.65 | 8.29 | 18.27 | 0.3521 | 0.0358 | |||
| MPC / Marathon Petroleum Corporation | 0.05 | 18.28 | 8.17 | 26.59 | 0.3468 | 0.0557 | |||
| SEE / Sealed Air Corporation | 0.25 | 9.67 | 8.07 | 3.33 | 0.3427 | -0.0097 | |||
| NVR / NVR, Inc. | 0.00 | 26.43 | 8.00 | 24.17 | 0.3397 | 0.0490 | |||
| CG / The Carlyle Group Inc. | 0.17 | 5.65 | 7.90 | -4.18 | 0.3356 | -0.0366 | |||
| AMAT / Applied Materials, Inc. | 0.05 | 9.67 | 7.83 | 8.77 | 0.3325 | 0.0077 | |||
| EQT / EQT Corporation | 0.14 | 5.65 | 7.80 | 20.91 | 0.3313 | 0.0402 | |||
| RS / Reliance, Inc. | 0.03 | 5.65 | 7.52 | 4.10 | 0.3193 | -0.0066 | |||
| THC / Tenet Healthcare Corporation | 0.04 | 7.50 | 0.3186 | 0.3186 | |||||
| EXPD / Expeditors International of Washington, Inc. | 0.07 | -14.25 | 7.36 | -17.63 | 0.3126 | -0.0906 | |||
| FITB / Fifth Third Bancorp | 0.18 | -31.65 | 6.99 | -39.95 | 0.2970 | -0.2285 | |||
| LAMR / Lamar Advertising Company | 0.06 | 5.65 | 6.97 | 2.52 | 0.2960 | -0.0108 | |||
| ZBRA / Zebra Technologies Corporation | 0.02 | 5.64 | 6.92 | -2.84 | 0.2939 | -0.0275 | |||
| PH / Parker-Hannifin Corporation | 0.01 | 5.67 | 6.90 | 5.07 | 0.2931 | -0.0033 | |||
| RRC / Range Resources Corporation | 0.18 | 5.65 | 6.71 | 8.27 | 0.2848 | 0.0053 | |||
| FTI / TechnipFMC plc | 0.21 | 6.66 | 0.2829 | 0.2829 | |||||
| SYF / Synchrony Financial | 0.11 | -6.70 | 6.62 | -11.36 | 0.2812 | -0.0559 | |||
| MCHP / Microchip Technology Incorporated | 0.11 | 74.07 | 6.60 | 71.68 | 0.2804 | 0.1068 | |||
| LHX / L3Harris Technologies, Inc. | 0.03 | -5.10 | 6.56 | 12.51 | 0.2788 | 0.0155 | |||
| MOS / The Mosaic Company | 0.18 | 5.65 | 6.54 | 59.61 | 0.2778 | 0.0929 | |||
| CHX / ChampionX Corporation | 0.27 | 9.67 | 6.47 | -11.42 | 0.2747 | -0.0548 | |||
| OGE / OGE Energy Corp. | 0.15 | 39.78 | 6.45 | 34.30 | 0.2740 | 0.0572 | |||
| LRCX / Lam Research Corporation | 0.08 | 105.19 | 6.41 | 116.05 | 0.2721 | 0.1383 | |||
| REG / Regency Centers Corporation | 0.09 | -4.82 | 6.38 | -10.47 | 0.2710 | -0.0506 | |||
| JBL / Jabil Inc. | 0.04 | 6.38 | 0.2708 | 0.2708 | |||||
| ESS / Essex Property Trust, Inc. | 0.02 | 62.89 | 6.25 | 48.46 | 0.2654 | 0.0754 | |||
| SLM / SLM Corporation | 0.19 | 5.65 | 6.19 | 13.28 | 0.2630 | 0.0163 | |||
| BYD / Boyd Gaming Corporation | 0.08 | 5.65 | 6.17 | 3.87 | 0.2621 | -0.0060 | |||
| FTDR / Frontdoor, Inc. | 0.11 | 5.65 | 6.08 | 27.81 | 0.2580 | 0.0435 | |||
| SOLV / Solventum Corporation | 0.08 | 7.21 | 6.05 | -1.74 | 0.2569 | -0.0209 | |||
| GEN / Gen Digital Inc. | 0.21 | 6.69 | 6.04 | 11.18 | 0.2564 | 0.0114 | |||
| ETR / Entergy Corporation | 0.07 | -6.07 | 5.96 | -10.40 | 0.2531 | -0.0470 | |||
| ALB / Albemarle Corporation | 0.10 | 9.67 | 5.77 | -20.60 | 0.2450 | -0.0829 | |||
| NTAP / NetApp, Inc. | 0.06 | 10.44 | 5.76 | 9.72 | 0.2445 | 0.0077 | |||
| DELL / Dell Technologies Inc. | 0.05 | 41.21 | 5.73 | 52.89 | 0.2435 | 0.0743 | |||
| GNRC / Generac Holdings Inc. | 0.05 | 5.63 | 5.72 | -5.25 | 0.2429 | -0.0295 | |||
| CDW / CDW Corporation | 0.03 | 268.77 | 5.60 | 194.79 | 0.2379 | 0.1452 | |||
| SSNC / SS&C Technologies Holdings, Inc. | 0.07 | -13.59 | 5.55 | -21.58 | 0.2357 | -0.0837 | |||
| WTS / Watts Water Technologies, Inc. | 0.02 | 25.40 | 5.54 | 41.49 | 0.2351 | 0.0585 | |||
| FANG / Diamondback Energy, Inc. | 0.04 | -5.21 | 5.51 | -19.76 | 0.2339 | -0.0759 | |||
| PRMB / Primo Brands Corporation | 0.17 | 100.18 | 5.50 | 96.53 | 0.2334 | 0.1072 | |||
| COKE / Coca-Cola Consolidated, Inc. | 0.05 | 1,376.23 | 5.48 | 19.43 | 0.2329 | 0.0257 | |||
| FLEX / Flex Ltd. | 0.13 | -23.84 | 5.43 | -14.98 | 0.2305 | -0.0575 | |||
| AON / Aon plc | 0.01 | -7.11 | 5.33 | -15.52 | 0.2265 | -0.0584 | |||
| BALL / Ball Corporation | 0.10 | 5.65 | 5.16 | 7.43 | 0.2191 | 0.0024 | |||
| EGP / EastGroup Properties, Inc. | 0.03 | 5.64 | 5.15 | -2.06 | 0.2186 | -0.0185 | |||
| AMG / Affiliated Managers Group, Inc. | 0.03 | 5.66 | 5.14 | 8.83 | 0.2182 | 0.0052 | |||
| TE Connectivity PLC / EC (IE000IVNQZ81) | 0.03 | 55.31 | 5.11 | 61.40 | 0.2171 | 0.0742 | |||
| TE Connectivity PLC / EC (IE000IVNQZ81) | 0.03 | 55.31 | 5.11 | 61.40 | 0.2171 | 0.0742 | |||
| CACI / CACI International Inc | 0.01 | 5.11 | 0.2171 | 0.2171 | |||||
| LDOS / Leidos Holdings, Inc. | 0.03 | 25.35 | 5.07 | 43.25 | 0.2154 | 0.0556 | |||
| RL / Ralph Lauren Corporation | 0.02 | -21.10 | 5.00 | -19.46 | 0.2122 | -0.0677 | |||
| MAR / Marriott International, Inc. | 0.02 | 74.41 | 4.89 | 99.02 | 0.2078 | 0.0724 | |||
| TRV / The Travelers Companies, Inc. | 0.02 | -9.01 | 4.89 | -2.96 | 0.2077 | -0.0197 | |||
| RKT / Rocket Companies, Inc. | 0.37 | 26.61 | 4.77 | 15.33 | 0.2025 | 0.0159 | |||
| VICI / VICI Properties Inc. | 0.15 | 5.65 | 4.76 | 3.12 | 0.2020 | -0.0061 | |||
| HRB / H&R Block, Inc. | 0.08 | -23.93 | 4.74 | -20.53 | 0.2011 | -0.0678 | |||
| IDCC / InterDigital, Inc. | 0.02 | 5.64 | 4.66 | 7.43 | 0.1978 | 0.0022 | |||
| ELS / Equity LifeStyle Properties, Inc. | 0.07 | 5.65 | 4.65 | -2.07 | 0.1973 | -0.0168 | |||
| NRG / NRG Energy, Inc. | 0.03 | -9.63 | 4.63 | 33.27 | 0.1967 | 0.0399 | |||
| UFPI / UFP Industries, Inc. | 0.05 | 66.41 | 4.56 | 51.76 | 0.1936 | 0.0580 | |||
| MCK / McKesson Corporation | 0.01 | 4.51 | 0.1916 | 0.1916 | |||||
| XRAY / DENTSPLY SIRONA Inc. | 0.28 | 9.67 | 4.49 | 5.92 | 0.1908 | -0.0006 | |||
| FCX / Freeport-McMoRan Inc. | 0.12 | 5.65 | 4.48 | 10.15 | 0.1904 | 0.0067 | |||
| CNP / CenterPoint Energy, Inc. | 0.12 | -8.98 | 4.35 | -1.43 | 0.1849 | -0.0144 | |||
| CCEP / COCA COLA EUROPACIFIC COMPANY GUAR REGS 11/27 1.5 | 0.05 | -9.47 | 4.35 | -3.68 | 0.1846 | -0.0190 | |||
| EQR / Equity Residential | 0.06 | 5.65 | 4.30 | -0.09 | 0.1827 | -0.0116 | |||
| CROX / Crocs, Inc. | 0.04 | 4.29 | 0.1820 | 0.1820 | |||||
| DD / DuPont de Nemours, Inc. | 0.06 | 5.65 | 4.23 | -13.70 | 0.1798 | -0.0415 | |||
| CMC / Commercial Metals Company | 0.09 | 5.65 | 4.22 | 1.61 | 0.1792 | -0.0082 | |||
| FE / FirstEnergy Corp. | 0.10 | -37.98 | 4.20 | -32.91 | 0.1782 | -0.1040 | |||
| BLD / TopBuild Corp. | 0.01 | 4.17 | 0.1770 | 0.1770 | |||||
| MMM / 3M Company | 0.03 | 4.11 | 0.1747 | 0.1747 | |||||
| CHRD / Chord Energy Corporation | 0.04 | 5.65 | 4.04 | -16.81 | 0.1717 | -0.0476 | |||
| FAF / First American Financial Corporation | 0.07 | 26.16 | 4.03 | 7.18 | 0.1711 | 0.0015 | |||
| MOH / Molina Healthcare, Inc. | 0.01 | 5.10 | 3.94 | 6.47 | 0.1671 | 0.0003 | |||
| WH / Wyndham Hotels & Resorts, Inc. | 0.05 | -28.25 | 3.90 | -45.17 | 0.1656 | -0.1553 | |||
| EQH / Equitable Holdings, Inc. | 0.07 | 3.89 | 0.1652 | 0.1652 | |||||
| EXR / Extra Space Storage Inc. | 0.03 | -12.62 | 3.85 | -13.43 | 0.1637 | -0.0372 | |||
| LW / Lamb Weston Holdings, Inc. | 0.07 | -14.71 | 3.80 | -8.28 | 0.1614 | -0.0256 | |||
| VOYA / Voya Financial, Inc. | 0.06 | 78.08 | 3.72 | 63.94 | 0.1581 | 0.0556 | |||
| MUR / Murphy Oil Corporation | 0.18 | 9.67 | 3.68 | -13.35 | 0.1563 | -0.0353 | |||
| LSTR / Landstar System, Inc. | 0.03 | 30.68 | 3.65 | 12.93 | 0.1551 | 0.0092 | |||
| MSM / MSC Industrial Direct Co., Inc. | 0.04 | 5.65 | 3.61 | 6.77 | 0.1534 | 0.0007 | |||
| CTSH / Cognizant Technology Solutions Corporation | 0.04 | 5.66 | 3.50 | 2.70 | 0.1488 | -0.0052 | |||
| FIS / Fidelity National Information Services, Inc. | 0.04 | 5.65 | 3.48 | 18.28 | 0.1478 | 0.0150 | |||
| LKQ / LKQ Corporation | 0.08 | 333.28 | 3.33 | 315.86 | 0.1415 | 0.1053 | |||
| DGX / Quest Diagnostics Incorporated | 0.02 | 5.65 | 3.31 | 5.91 | 0.1408 | -0.0004 | |||
| PSX / Phillips 66 | 0.03 | 5.66 | 3.29 | -7.54 | 0.1395 | -0.0208 | |||
| HP / Helmerich & Payne, Inc. | 0.21 | 9.67 | 3.22 | -36.92 | 0.1369 | -0.0937 | |||
| GNTX / Gentex Corporation | 0.15 | 5.65 | 3.21 | -6.30 | 0.1363 | -0.0183 | |||
| OKE / ONEOK, Inc. | 0.04 | 3.19 | 0.1355 | 0.1355 | |||||
| SAIC / Science Applications International Corporation | 0.03 | -14.71 | 3.14 | -0.25 | 0.1333 | -0.0087 | |||
| REZI / Resideo Technologies, Inc. | 0.15 | 5.65 | 3.14 | 13.87 | 0.1332 | 0.0089 | |||
| CART / Maplebear Inc. | 0.07 | 40.05 | 3.06 | 55.71 | 0.1297 | 0.0412 | |||
| CHDN / Churchill Downs Incorporated | 0.03 | -23.02 | 3.02 | -37.98 | 0.1283 | -0.0915 | |||
| COF / Capital One Financial Corporation | 0.02 | 2.97 | 0.1262 | 0.1262 | |||||
| ITT / ITT Inc. | 0.02 | 5.66 | 2.64 | 12.62 | 0.1122 | 0.0063 | |||
| BLDR / Builders FirstSource, Inc. | 0.02 | 64.12 | 2.48 | 27.13 | 0.1053 | 0.0173 | |||
| HOG / Harley-Davidson, Inc. | 0.10 | 5.65 | 2.45 | -0.69 | 0.1041 | -0.0073 | |||
| RHI / Robert Half Inc. | 0.05 | -35.28 | 2.32 | -49.86 | 0.0984 | -0.1101 | |||
| VVV / Valvoline Inc. | 0.06 | 5.65 | 2.08 | -0.91 | 0.0882 | -0.0064 | |||
| US57638P1049 / MasterBrand, Inc. | 0.17 | 5.65 | 1.77 | -22.99 | 0.0751 | -0.0285 | |||
| BBY / Best Buy Co., Inc. | 0.00 | -100.00 | 0.00 | -100.00 | -0.1237 | ||||
| SLB / Schlumberger Limited | 0.00 | -100.00 | 0.00 | -100.00 | -0.1525 | ||||
| MATX / Matson, Inc. | 0.00 | -100.00 | 0.00 | -100.00 | -0.1068 |