Basic Stats
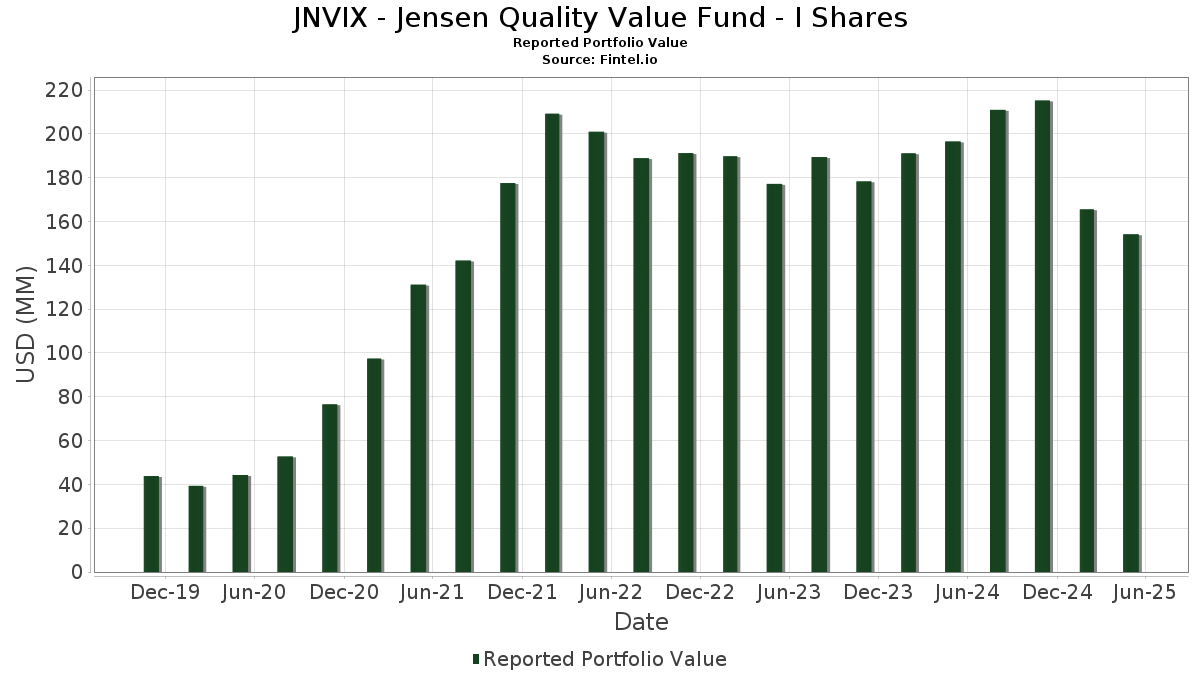
| Portfolio Value | $ 154,180,200 |
| Current Positions | 35 |
Latest Holdings, Performance, AUM (from 13F, 13D)
JNVIX - Jensen Quality Value Fund - I Shares has disclosed 35 total holdings in their latest SEC filings. Most recent portfolio value is calculated to be $ 154,180,200 USD. Actual Assets Under Management (AUM) is this value plus cash (which is not disclosed). JNVIX - Jensen Quality Value Fund - I Shares’s top holdings are Labcorp Holdings Inc. (US:LH) , Broadridge Financial Solutions, Inc. (US:BR) , Encompass Health Corporation (US:EHC) , Equifax Inc. (US:EFX) , and Veeva Systems Inc. (US:VEEV) .
Top Increases This Quarter
We use the change in the portfolio allocation because this is the most meaningful metric. Changes can be due to trades or changes in share prices.
| Security | Shares (MM) |
Value (MM$) |
Portfolio % | ΔPortfolio % |
|---|---|---|---|---|
| 0.01 | 5.80 | 3.7650 | 1.7008 | |
| 0.02 | 6.39 | 4.1519 | 1.1943 | |
| 0.06 | 5.80 | 3.7688 | 0.5807 | |
| 0.04 | 5.44 | 3.5364 | 0.4392 | |
| 0.03 | 6.74 | 4.3815 | 0.4308 | |
| 0.04 | 5.56 | 3.6144 | 0.3581 | |
| 0.01 | 4.50 | 2.9243 | 0.3549 | |
| 0.01 | 5.44 | 3.5320 | 0.3333 | |
| 0.06 | 6.96 | 4.5206 | 0.2373 | |
| 0.07 | 4.65 | 3.0185 | 0.2310 |
Top Decreases This Quarter
We use the change in the portfolio allocation because this is the most meaningful metric. Changes can be due to trades or changes in share prices.
| Security | Shares (MM) |
Value (MM$) |
Portfolio % | ΔPortfolio % |
|---|---|---|---|---|
| 0.13 | 5.62 | 3.6476 | -0.9493 | |
| 0.03 | 2.15 | 1.3998 | -0.8454 | |
| 0.11 | 5.73 | 3.7245 | -0.5813 | |
| 0.04 | 4.16 | 2.7033 | -0.5556 | |
| 0.00 | 1.90 | 1.2333 | -0.4007 | |
| 0.11 | 5.15 | 3.3450 | -0.3087 | |
| 0.02 | 2.58 | 1.6750 | -0.3069 | |
| 0.05 | 2.30 | 1.4919 | -0.2775 | |
| 0.04 | 5.29 | 3.4388 | -0.2416 | |
| 0.16 | 2.74 | 1.7796 | -0.2258 |
13F and Fund Filings
This form was filed on 2025-07-29 for the reporting period 2025-05-31. Click the link icon to see the full transaction history.
Upgrade to unlock premium data and export to Excel ![]() .
.
| Security | Type | Avg Share Price | Shares (MM) |
ΔShares (%) |
ΔShares (%) |
Value ($MM) |
Portfolio (%) |
ΔPortfolio (%) |
|
|---|---|---|---|---|---|---|---|---|---|
| LH / Labcorp Holdings Inc. | 0.03 | -10.03 | 7.10 | -10.77 | 4.6126 | -0.1931 | |||
| BR / Broadridge Financial Solutions, Inc. | 0.03 | -10.32 | 6.96 | -9.71 | 4.5240 | -0.1344 | |||
| EHC / Encompass Health Corporation | 0.06 | -18.73 | 6.96 | -1.88 | 4.5206 | 0.2373 | |||
| EFX / Equifax Inc. | 0.03 | -4.31 | 6.74 | 3.10 | 4.3815 | 0.4308 | |||
| VEEV / Veeva Systems Inc. | 0.02 | 4.58 | 6.39 | 30.51 | 4.1519 | 1.1943 | |||
| CCK / Crown Holdings, Inc. | 0.06 | 0.00 | 5.80 | 9.89 | 3.7688 | 0.5807 | |||
| IDXX / IDEXX Laboratories, Inc. | 0.01 | 44.37 | 5.80 | 69.54 | 3.7650 | 1.7008 | |||
| CPRT / Copart, Inc. | 0.11 | -14.40 | 5.73 | -19.59 | 3.7245 | -0.5813 | |||
| G / Genpact Limited | 0.13 | -8.81 | 5.62 | -26.23 | 3.6476 | -0.9493 | |||
| KEYS / Keysight Technologies, Inc. | 0.04 | 4.82 | 5.56 | 3.17 | 3.6144 | 0.3581 | |||
| KR / The Kroger Co. | 0.08 | -12.34 | 5.47 | -7.74 | 3.5565 | -0.0268 | |||
| ROST / Ross Stores, Inc. | 0.04 | 6.32 | 5.44 | 6.14 | 3.5364 | 0.4392 | |||
| MSCI / MSCI Inc. | 0.01 | 7.47 | 5.44 | 2.66 | 3.5320 | 0.3333 | |||
| CLX / The Clorox Company | 0.04 | 3.00 | 5.29 | -13.14 | 3.4388 | -0.2416 | |||
| TSCO / Tractor Supply Company | 0.11 | -2.67 | 5.15 | -14.89 | 3.3450 | -0.3087 | |||
| FDS / FactSet Research Systems Inc. | 0.01 | 0.00 | 4.77 | -0.77 | 3.0960 | 0.1960 | |||
| DCI / Donaldson Company, Inc. | 0.07 | 0.00 | 4.65 | 0.67 | 3.0185 | 0.2310 | |||
| VRSK / Verisk Analytics, Inc. | 0.01 | 0.00 | 4.50 | 5.81 | 2.9243 | 0.3549 | |||
| FFIV / F5, Inc. | 0.01 | -10.72 | 4.28 | -12.87 | 2.7789 | -0.1861 | |||
| CHD / Church & Dwight Co., Inc. | 0.04 | -12.78 | 4.16 | -22.89 | 2.7033 | -0.5556 | |||
| BAH / Booz Allen Hamilton Holding Corporation | 0.04 | -10.29 | 3.92 | -10.14 | 2.5455 | -0.0875 | |||
| GIS / General Mills, Inc. | 0.07 | 3.91 | 3.71 | -7.00 | 2.4099 | 0.0011 | |||
| APD / Air Products and Chemicals, Inc. | 0.01 | 0.00 | 3.53 | -11.79 | 2.2902 | -0.1231 | |||
| GNTX / Gentex Corporation | 0.16 | 4.19 | 3.48 | -7.59 | 2.2635 | -0.0135 | |||
| CPB / The Campbell's Company | 0.10 | 0.00 | 3.25 | -15.02 | 2.1129 | -0.1987 | |||
| HOLX / Hologic, Inc. | 0.05 | 5.18 | 3.19 | 3.17 | 2.0730 | 0.2049 | |||
| TTC / The Toro Company | 0.04 | 0.00 | 2.99 | -5.50 | 1.9430 | 0.0312 | |||
| LEVI / Levi Strauss & Co. | 0.16 | -14.56 | 2.74 | -17.50 | 1.7796 | -0.2258 | |||
| MANH / Manhattan Associates, Inc. | 0.01 | 0.00 | 2.62 | 6.72 | 1.7022 | 0.2195 | |||
| GPC / Genuine Parts Company | 0.02 | -22.45 | 2.58 | -21.43 | 1.6750 | -0.3069 | |||
| TECH / Bio-Techne Corporation | 0.05 | 0.00 | 2.30 | -21.64 | 1.4919 | -0.2775 | |||
| FXFXX / First American Funds Inc - First American Treasury Obligations Fund Class X | 2.26 | 10.03 | 2.26 | 10.05 | 1.4652 | 0.2273 | |||
| BBY / Best Buy Co., Inc. | 0.03 | -21.38 | 2.15 | -42.05 | 1.3998 | -0.8454 | |||
| URI / United Rentals, Inc. | 0.00 | -42.37 | 1.90 | -44.92 | 1.2333 | -0.4007 | |||
| ON / ON Semiconductor Corporation | 0.04 | 0.00 | 1.74 | -10.72 | 1.1314 | -0.0463 |