Basic Stats
| Insider Profile | TRIAN FUND MANAGEMENT, L.P. |
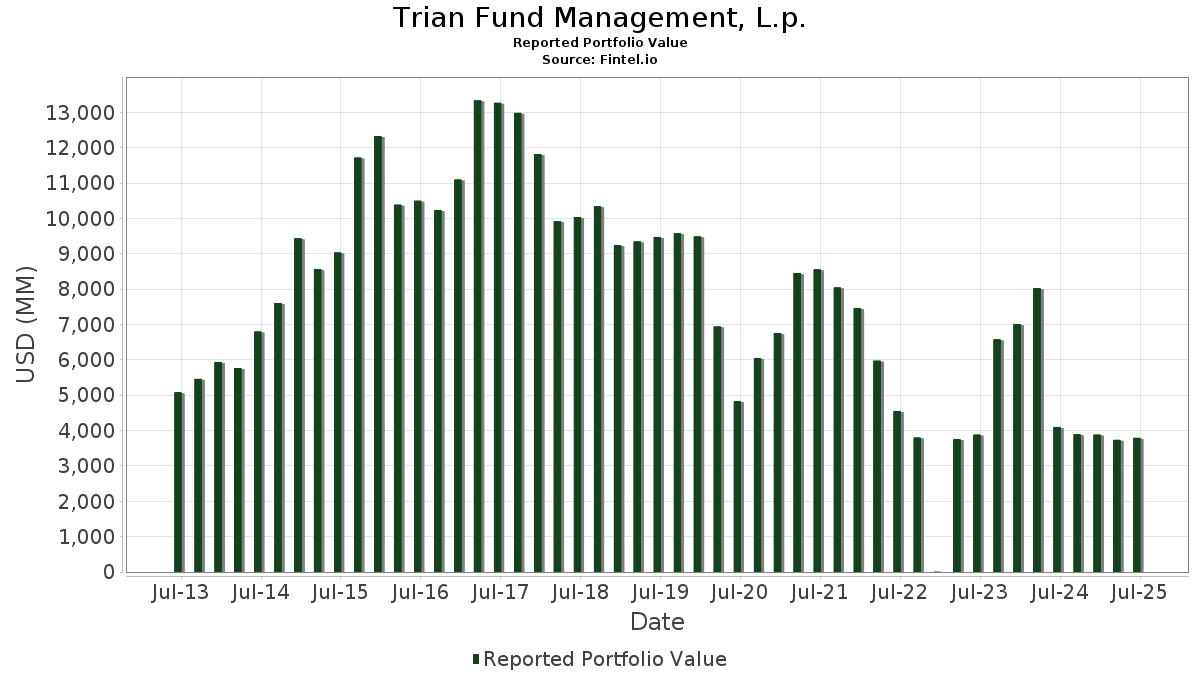
| Portfolio Value | $ 3,791,909,471 |
| Current Positions | 10 |
Latest Holdings, Performance, AUM (from 13F, 13D)
Trian Fund Management, L.p. has disclosed 10 total holdings in their latest SEC filings. Most recent portfolio value is calculated to be $ 3,791,909,471 USD. Actual Assets Under Management (AUM) is this value plus cash (which is not disclosed). Trian Fund Management, L.p.’s top holdings are Janus Henderson Group plc (US:JHG) , General Electric Company (US:GE) , Solventum Corporation (US:SOLV) , The Wendy's Company (US:WEN) , and Invesco Ltd. (US:IVZ) . Trian Fund Management, L.p.’s new positions include Allstate Corp. (The) (US:ALL.PRD) , .
Top Increases This Quarter
We use the change in the portfolio allocation because this is the most meaningful metric. Changes can be due to trades or changes in share prices.
| Security | Shares (MM) |
Value (MM$) |
Portfolio % | ΔPortfolio % |
|---|---|---|---|---|
| 4.03 | 1,037.34 | 27.3566 | 6.9576 | |
| 31.87 | 1,237.75 | 32.6417 | 3.5088 | |
| 8.46 | 641.82 | 16.9260 | 0.6525 |
Top Decreases This Quarter
We use the change in the portfolio allocation because this is the most meaningful metric. Changes can be due to trades or changes in share prices.
| Security | Shares (MM) |
Value (MM$) |
Portfolio % | ΔPortfolio % |
|---|---|---|---|---|
| 14.63 | 230.69 | 5.8218 | -3.0682 | |
| 30.43 | 347.57 | 9.1660 | -2.0899 | |
| 0.34 | 18.38 | 0.4638 | -1.2194 | |
| 0.35 | 21.40 | 0.5400 | -0.5377 | |
| 0.00 | 0.30 | 0.0075 | -0.0007 |
13F and Fund Filings
This form was filed on 2025-08-14 for the reporting period 2025-06-30. Click the link icon to see the full transaction history.
Upgrade to unlock premium data and export to Excel ![]() .
.
| Security | Type | Avg Share Price | Shares (MM) |
ΔShares (%) |
ΔShares (%) |
Value ($MM) |
Portfolio (%) |
ΔPortfolio (%) |
|
|---|---|---|---|---|---|---|---|---|---|
| JHG / Janus Henderson Group plc | 31.87 | 0.00 | 1,237.75 | 7.44 | 32.6417 | 3.5088 | |||
| GE / General Electric Company | 4.03 | 0.00 | 1,037.34 | 28.60 | 27.3566 | 6.9576 | |||
| SOLV / Solventum Corporation | 8.46 | 0.00 | 641.82 | -0.26 | 16.9260 | 0.6525 | |||
| WEN / The Wendy's Company | 30.43 | 0.04 | 347.57 | -21.91 | 9.1660 | -2.0899 | |||
| Ferguson Plc New / SHS (G3421J106) | 1.09 | 236.55 | 0.0000 | ||||||
| IVZ / Invesco Ltd. | 14.63 | -36.87 | 230.69 | -34.38 | 5.8218 | -3.0682 | |||
| UHAL / U-Haul Holding Company | 0.35 | -45.81 | 21.40 | -49.79 | 0.5400 | -0.5377 | |||
| ALL.PRD / Allstate Corp. (The) | 0.10 | 20.12 | 0.0000 | ||||||
| UHALB / U-Haul Holding Company - Series N | 0.34 | -69.94 | 18.38 | -72.39 | 0.4638 | -1.2194 | |||
| GEHC / GE HealthCare Technologies Inc. | 0.00 | 0.00 | 0.30 | -8.31 | 0.0075 | -0.0007 |