Basic Stats
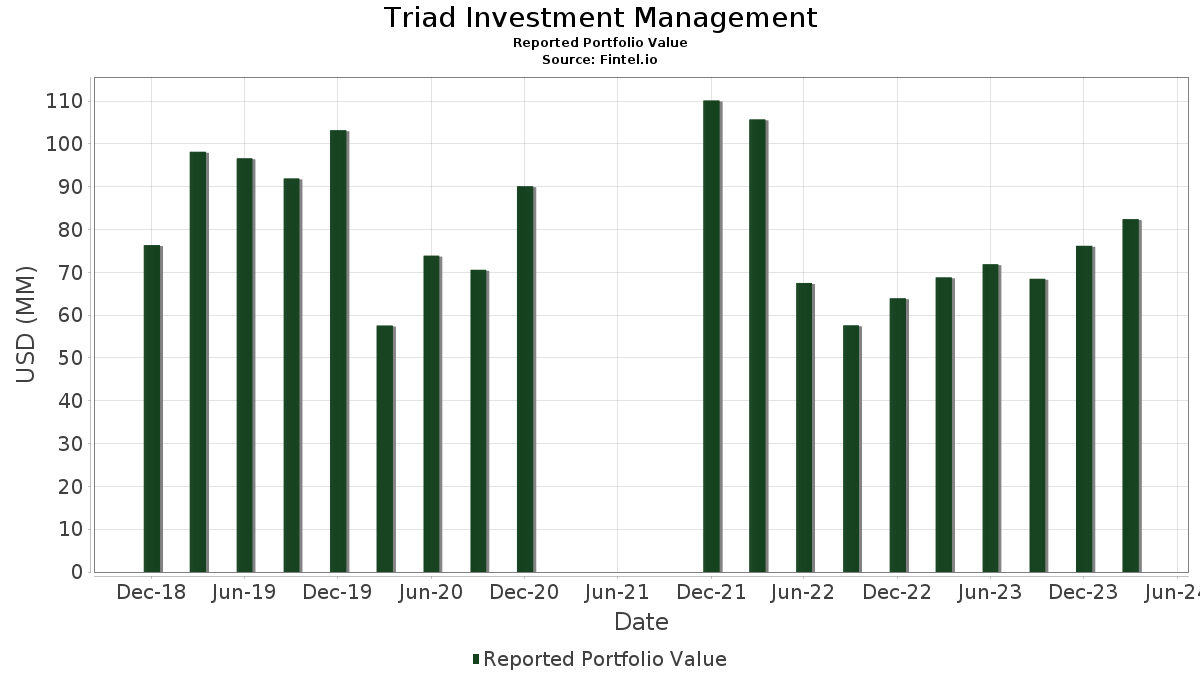
| Portfolio Value | $ 82,418,047 |
| Current Positions | 42 |
Latest Holdings, Performance, AUM (from 13F, 13D)
Triad Investment Management has disclosed 42 total holdings in their latest SEC filings. Most recent portfolio value is calculated to be $ 82,418,047 USD. Actual Assets Under Management (AUM) is this value plus cash (which is not disclosed). Triad Investment Management’s top holdings are MediaAlpha, Inc. (US:MAX) , Gartner, Inc. (US:IT) , Cannae Holdings, Inc. (US:CNNE) , Vanguard Scottsdale Funds - Vanguard Short-Term Treasury ETF (US:VGSH) , and Schlumberger Limited (US:SLB) . Triad Investment Management’s new positions include Generac Holdings Inc. (US:GNRC) , Qurate Retail Inc - Series A (US:QRTEA) , . Triad Investment Management’s top industries are "Fabricated Metal Products, Except Machinery And Transportation Equipment" (sic 34) , "Rubber And Miscellaneous Plastics Products" (sic 30) , and "Apparel And Accessory Stores" (sic 56) .
Top Increases This Quarter
We use the change in the portfolio allocation because this is the most meaningful metric. Changes can be due to trades or changes in share prices.
| Security | Shares (MM) |
Value (MM$) |
Portfolio % | ΔPortfolio % |
|---|---|---|---|---|
| 0.25 | 5.07 | 6.1516 | 2.5142 | |
| 0.20 | 4.47 | 5.4204 | 0.8392 | |
| 0.19 | 3.64 | 4.4201 | 0.8303 | |
| 0.04 | 2.90 | 3.5222 | 0.6127 | |
| 0.04 | 3.45 | 4.1893 | 0.5839 | |
| 0.01 | 1.68 | 2.0385 | 0.4123 | |
| 0.00 | 3.20 | 3.8817 | 0.3930 | |
| 0.02 | 2.28 | 2.7684 | 0.3682 | |
| 0.04 | 3.19 | 3.8718 | 0.2958 | |
| 0.00 | 0.23 | 0.2810 | 0.2810 |
Top Decreases This Quarter
We use the change in the portfolio allocation because this is the most meaningful metric. Changes can be due to trades or changes in share prices.
| Security | Shares (MM) |
Value (MM$) |
Portfolio % | ΔPortfolio % |
|---|---|---|---|---|
| 0.01 | 4.77 | 5.7922 | -1.1440 | |
| 0.08 | 4.11 | 4.9901 | -0.9717 | |
| 0.00 | 2.21 | 2.6834 | -0.7210 | |
| 0.02 | 1.58 | 1.9188 | -0.6835 | |
| 0.07 | 4.35 | 5.2729 | -0.4608 | |
| 0.01 | 2.35 | 2.8540 | -0.4408 | |
| 0.23 | 2.03 | 2.4667 | -0.3701 | |
| 0.01 | 1.57 | 1.9071 | -0.2267 | |
| 0.00 | 0.00 | -0.1728 | ||
| 0.03 | 3.77 | 4.5734 | -0.1716 |
13D/G Filings
This is a list of 13D and 13G filings made in the last year (if any). Click the link icon to see the full transaction history. Green rows indicate new positions. Red rows indicate closed positions.
| File Date | Form | Security | Prev Shares |
Current Shares |
ΔShares % | % Ownership |
% ΔOwnership | |
|---|---|---|---|---|---|---|---|---|
| 2024-12-30 | LTRPA / Liberty TripAdvisor Holdings, Inc. | 4,414,907 | 3,610,246 | -18.23 | 0.00 | -100.00 |
13F and Fund Filings
This form was filed on 2024-04-12 for the reporting period 2024-03-31. Click the link icon to see the full transaction history.
Upgrade to unlock premium data and export to Excel ![]() .
.
| Security | Type | Avg Share Price | Shares (MM) |
ΔShares (%) |
ΔShares (%) |
Value ($MM) |
Portfolio (%) |
ΔPortfolio (%) |
|
|---|---|---|---|---|---|---|---|---|---|
| MAX / MediaAlpha, Inc. | 0.25 | 0.15 | 5.07 | 82.93 | 6.1516 | 2.5142 | |||
| IT / Gartner, Inc. | 0.01 | -14.50 | 4.77 | -9.67 | 5.7922 | -1.1440 | |||
| CNNE / Cannae Holdings, Inc. | 0.20 | 12.29 | 4.47 | 27.99 | 5.4204 | 0.8392 | |||
| VGSH / Vanguard Scottsdale Funds - Vanguard Short-Term Treasury ETF | 0.07 | -0.07 | 4.35 | -0.53 | 5.2729 | -0.4608 | |||
| SLB / Schlumberger Limited | 0.08 | -14.03 | 4.11 | -9.45 | 4.9901 | -0.9717 | |||
| FI / Fiserv, Inc. | 0.03 | -10.42 | 4.01 | 7.77 | 4.8659 | -0.0185 | |||
| THO / THOR Industries, Inc. | 0.03 | 5.08 | 3.77 | 4.29 | 4.5734 | -0.1716 | |||
| OCSL / Oaktree Specialty Lending Corporation | 0.19 | 38.35 | 3.64 | 33.21 | 4.4201 | 0.8303 | |||
| KMX / CarMax, Inc. | 0.04 | 10.74 | 3.45 | 25.71 | 4.1893 | 0.5839 | |||
| SSNC / SS&C Technologies Holdings, Inc. | 0.05 | 2.29 | 3.42 | 7.74 | 4.1554 | -0.0167 | |||
| KFY / Korn Ferry | 0.05 | 1.76 | 3.29 | 12.75 | 3.9922 | 0.1615 | |||
| WTM / White Mountains Insurance Group, Ltd. | 0.00 | 0.96 | 3.20 | 20.40 | 3.8817 | 0.3930 | |||
| BRO / Brown & Brown, Inc. | 0.04 | -4.85 | 3.19 | 17.14 | 3.8718 | 0.2958 | |||
| CDW / CDW Corporation | 0.01 | -7.93 | 3.04 | 3.61 | 3.6912 | -0.1635 | |||
| FIS / Fidelity National Information Services, Inc. | 0.04 | 6.05 | 2.90 | 30.96 | 3.5222 | 0.6127 | |||
| V / Visa Inc. | 0.01 | -12.58 | 2.35 | -6.29 | 2.8540 | -0.4408 | |||
| VAC / Marriott Vacations Worldwide Corporation | 0.02 | -1.68 | 2.28 | 24.78 | 2.7684 | 0.3682 | |||
| ROP / Roper Technologies, Inc. | 0.00 | -17.11 | 2.21 | -14.73 | 2.6834 | -0.7210 | |||
| WBD / Warner Bros. Discovery, Inc. | 0.23 | 22.63 | 2.03 | -5.92 | 2.4667 | -0.3701 | |||
| HTGC / Hercules Capital, Inc. | 0.11 | 2.80 | 2.01 | 13.79 | 2.4446 | 0.1201 | |||
| AXP / American Express Company | 0.01 | 0.00 | 1.85 | 21.52 | 2.2482 | 0.2470 | |||
| MHK / Mohawk Industries, Inc. | 0.01 | 7.23 | 1.68 | 35.70 | 2.0385 | 0.4123 | |||
| CBRE / CBRE Group, Inc. | 0.02 | -23.64 | 1.58 | -20.23 | 1.9188 | -0.6835 | |||
| ENTG / Entegris, Inc. | 0.01 | -17.56 | 1.57 | -3.32 | 1.9071 | -0.2267 | |||
| SLRC / SLR Investment Corp. | 0.09 | 2.74 | 1.44 | 4.88 | 1.7494 | -0.0544 | |||
| BRK.B / Berkshire Hathaway Inc. | 0.00 | -6.05 | 1.12 | 10.71 | 1.3552 | 0.0317 | |||
| JNJ / Johnson & Johnson | 0.01 | 0.00 | 0.80 | 1.01 | 0.9720 | -0.0699 | |||
| DHR / Danaher Corporation | 0.00 | 5.14 | 0.70 | 13.47 | 0.8493 | 0.0397 | |||
| MSFT / Microsoft Corporation | 0.00 | 0.00 | 0.68 | 11.76 | 0.8310 | 0.0275 | |||
| INTU / Intuit Inc. | 0.00 | 0.00 | 0.43 | 3.90 | 0.5174 | -0.0208 | |||
| SPGI / S&P Global Inc. | 0.00 | 0.82 | 0.37 | -2.66 | 0.4445 | -0.0494 | |||
| MRK / Merck & Co., Inc. | 0.00 | 0.00 | 0.35 | 20.96 | 0.4283 | 0.0455 | |||
| WSO / Watsco, Inc. | 0.00 | 1.04 | 0.34 | 1.82 | 0.4067 | -0.0252 | |||
| GOOG / Alphabet Inc. | 0.00 | 0.00 | 0.31 | 8.10 | 0.3732 | -0.0005 | |||
| CMCSA / Comcast Corporation | 0.01 | 0.00 | 0.30 | -1.31 | 0.3664 | -0.0346 | |||
| WFC / Wells Fargo & Company | 0.01 | 0.00 | 0.29 | 17.48 | 0.3516 | 0.0286 | |||
| AMPS / Altus Power, Inc. | 0.06 | 48.23 | 0.28 | 3.75 | 0.3365 | -0.0144 | |||
| GNRC / Generac Holdings Inc. | 0.00 | 0.23 | 0.2810 | 0.2810 | |||||
| RIG / Transocean Ltd. | 0.03 | 0.00 | 0.19 | -1.53 | 0.2354 | -0.0221 | |||
| PR / Permian Resources Corporation | 0.01 | -26.77 | 0.18 | -5.24 | 0.2206 | -0.0304 | |||
| CLAR / Clarus Corporation | 0.02 | 0.00 | 0.12 | -2.44 | 0.1465 | -0.0154 | |||
| QRTEA / Qurate Retail Inc - Series A | 0.01 | 0.01 | 0.0149 | 0.0149 | |||||
| DNB / Dun & Bradstreet Holdings, Inc. | 0.00 | -100.00 | 0.00 | 0.0000 | |||||
| PSFE / Paysafe Limited | 0.00 | -100.00 | 0.00 | -100.00 | -0.1728 | ||||
| SCHW / The Charles Schwab Corporation | 0.00 | -100.00 | 0.00 | 0.0000 | |||||
| NLY / Annaly Capital Management, Inc. | 0.00 | -100.00 | 0.00 | 0.0000 |