Basic Stats
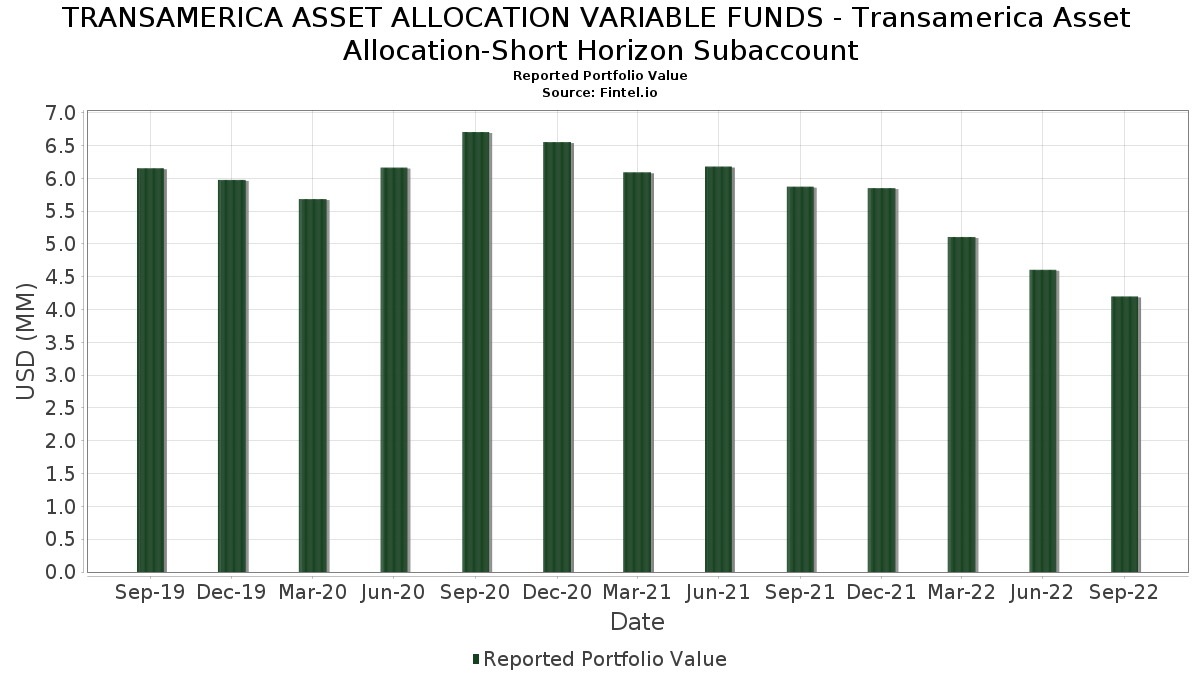
| Portfolio Value | $ 4,199,263 |
| Current Positions | 10 |
Latest Holdings, Performance, AUM (from 13F, 13D)
TRANSAMERICA ASSET ALLOCATION VARIABLE FUNDS - Transamerica Asset Allocation-Short Horizon Subaccount has disclosed 10 total holdings in their latest SEC filings. Most recent portfolio value is calculated to be $ 4,199,263 USD. Actual Assets Under Management (AUM) is this value plus cash (which is not disclosed). TRANSAMERICA ASSET ALLOCATION VARIABLE FUNDS - Transamerica Asset Allocation-Short Horizon Subaccount’s top holdings are TRANSAMERICA PARTNERS VAR FDS PARTNERS CORE DB SUBACCOUNT (US:US8935884002) , TRANSAMERICA PARTNERS VAR FDS PARTNERS HIGH QUALITY BD (SUB) (US:US8935887070) , TRANSAMERICA PARTNERS VAR FDS PARTNERS INFLATION PROTECTED (US:US8935888896) , TRANSAMERICA PARTNERS VAR FDS PARTNERS HIGH YIELD BD (SUB) (US:US8935888060) , and TRANSAMERICA PARTNERS VAR FDS PARTNERS LARGE VALUE (SUBACCT) (US:US8935888482) .
Top Increases This Quarter
We use the change in the portfolio allocation because this is the most meaningful metric. Changes can be due to trades or changes in share prices.
| Security | Shares (MM) |
Value (MM$) |
Portfolio % | ΔPortfolio % |
|---|---|---|---|---|
| 0.04 | 0.73 | 17.3999 | 0.5509 | |
| 0.00 | 0.12 | 2.9185 | 0.1867 | |
| 0.00 | 0.04 | 0.9969 | 0.0752 | |
| 0.00 | 0.04 | 0.9623 | 0.0406 | |
| 0.00 | 0.08 | 1.9515 | 0.0002 |
Top Decreases This Quarter
We use the change in the portfolio allocation because this is the most meaningful metric. Changes can be due to trades or changes in share prices.
| Security | Shares (MM) |
Value (MM$) |
Portfolio % | ΔPortfolio % |
|---|---|---|---|---|
| 0.01 | 0.42 | 9.9609 | -0.3477 | |
| 0.03 | 0.70 | 16.6660 | -0.2421 | |
| 0.04 | 1.94 | 46.1032 | -0.1111 | |
| 0.00 | 0.01 | 0.1195 | -0.1064 | |
| 0.00 | 0.12 | 2.9384 | -0.0054 |
13F and Fund Filings
This form was filed on 2022-11-28 for the reporting period 2022-09-30. Click the link icon to see the full transaction history.
Upgrade to unlock premium data and export to Excel ![]() .
.
| Security | Type | Avg Share Price | Shares (MM) |
ΔShares (%) |
ΔShares (%) |
Value ($MM) |
Portfolio (%) |
ΔPortfolio (%) |
|
|---|---|---|---|---|---|---|---|---|---|
| US8935884002 / TRANSAMERICA PARTNERS VAR FDS PARTNERS CORE DB SUBACCOUNT | 0.04 | -4.30 | 1.94 | -9.07 | 46.1032 | -0.1111 | |||
| US8935887070 / TRANSAMERICA PARTNERS VAR FDS PARTNERS HIGH QUALITY BD (SUB) | 0.04 | -4.85 | 0.73 | -5.81 | 17.3999 | 0.5509 | |||
| US8935888896 / TRANSAMERICA PARTNERS VAR FDS PARTNERS INFLATION PROTECTED | 0.03 | -4.95 | 0.70 | -10.15 | 16.6660 | -0.2421 | |||
| US8935888060 / TRANSAMERICA PARTNERS VAR FDS PARTNERS HIGH YIELD BD (SUB) | 0.01 | -10.73 | 0.42 | -11.81 | 9.9609 | -0.3477 | |||
| US8935888482 / TRANSAMERICA PARTNERS VAR FDS PARTNERS LARGE VALUE (SUBACCT) | 0.00 | -4.10 | 0.12 | -8.89 | 2.9384 | -0.0054 | |||
| US8935885090 / TRANSAMERICA PARTNERS VAR FDS PARTNERS LARGE GWOTH (SUBACCT) | 0.00 | -2.87 | 0.12 | -2.40 | 2.9185 | 0.1867 | |||
| US8935888714 / TRANSAMERICA PARTNERS VAR FDS PARTNERS INTL EQUITY (SUBACCT) | 0.00 | 3.61 | 0.08 | -8.99 | 1.9515 | 0.0002 | |||
| Transamerica Variable Small Cap Growth / EC (000000000) | 0.00 | -30.68 | 0.04 | -32.79 | 0.9969 | 0.0752 | |||
| Transamerica Variable Small Cap Value / EC (000000000) | 0.00 | -51.63 | 0.04 | -34.43 | 0.9623 | 0.0406 | |||
| US8935888631 / TRANSAMERICA PARTNERS VAR FDS PARTNERS MONEY MARKET (SUB) | 0.00 | -51.85 | 0.01 | -50.00 | 0.1195 | -0.1064 |