Basic Stats
| Insider Profile | TOWLE & CO |
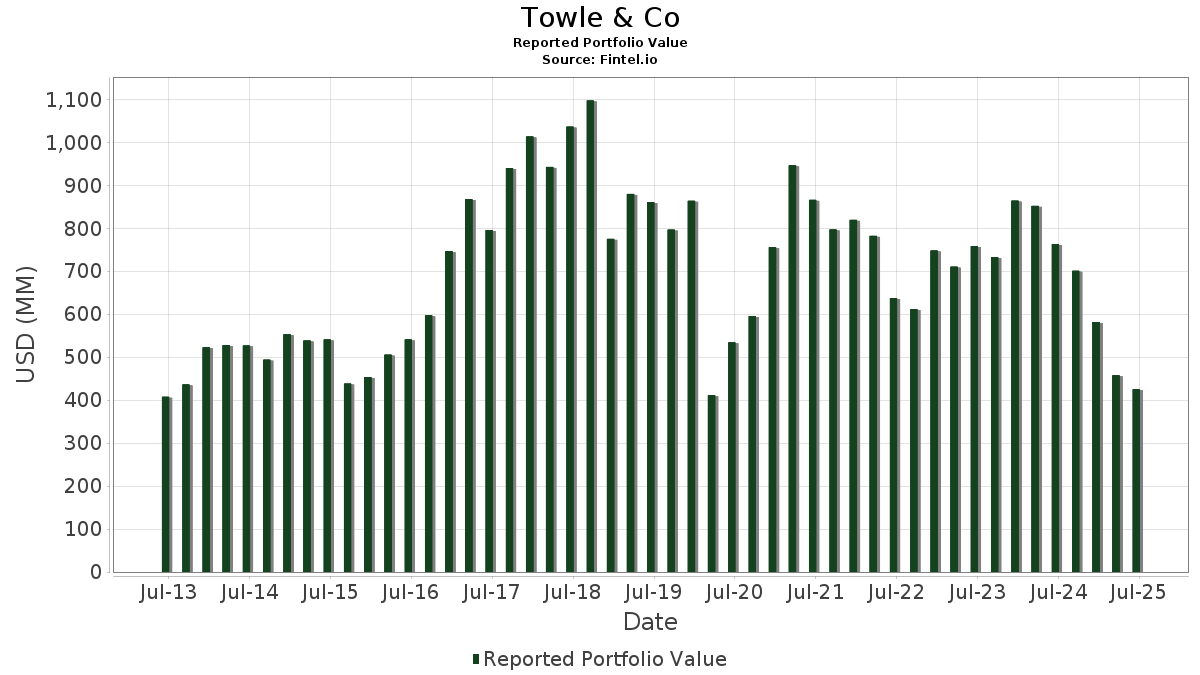
| Portfolio Value | $ 425,206,644 |
| Current Positions | 56 |
Latest Holdings, Performance, AUM (from 13F, 13D)
Towle & Co has disclosed 56 total holdings in their latest SEC filings. Most recent portfolio value is calculated to be $ 425,206,644 USD. Actual Assets Under Management (AUM) is this value plus cash (which is not disclosed). Towle & Co’s top holdings are Par Pacific Holdings, Inc. (US:PARR) , Sonic Automotive, Inc. (US:SAH) , Delek US Holdings, Inc. (US:DK) , HF Sinclair Corporation (US:DINO) , and Tyson Foods, Inc. (US:TSN) . Towle & Co’s new positions include Bloomin' Brands, Inc. (US:BLMN) , Methode Electronics, Inc. (US:MEI) , Cushman & Wakefield plc (US:CWK) , Sleep Number Corporation (US:SNBR) , and BorgWarner Inc. (US:BWA) .
Top Increases This Quarter
We use the change in the portfolio allocation because this is the most meaningful metric. Changes can be due to trades or changes in share prices.
| Security | Shares (MM) |
Value (MM$) |
Portfolio % | ΔPortfolio % |
|---|---|---|---|---|
| 0.16 | 12.54 | 2.9489 | 2.9489 | |
| 1.10 | 9.47 | 2.2281 | 2.2281 | |
| 0.96 | 9.09 | 2.1380 | 2.1380 | |
| 0.81 | 8.99 | 2.1152 | 2.1152 | |
| 0.66 | 17.51 | 4.1177 | 1.8161 | |
| 0.33 | 8.89 | 2.0899 | 1.8059 | |
| 0.07 | 7.29 | 1.7139 | 1.7139 | |
| 0.97 | 6.59 | 1.5488 | 1.5488 | |
| 0.47 | 11.50 | 2.7049 | 0.8727 | |
| 0.65 | 13.71 | 3.2240 | 0.8195 |
Top Decreases This Quarter
We use the change in the portfolio allocation because this is the most meaningful metric. Changes can be due to trades or changes in share prices.
| Security | Shares (MM) |
Value (MM$) |
Portfolio % | ΔPortfolio % |
|---|---|---|---|---|
| 0.13 | 0.50 | 0.1171 | -1.6793 | |
| 3.19 | 9.04 | 2.1261 | -1.5592 | |
| 1.01 | 6.05 | 1.4232 | -1.2578 | |
| 0.17 | 7.70 | 1.8112 | -1.2172 | |
| 0.50 | 7.60 | 1.7862 | -1.0997 | |
| 0.23 | 13.05 | 3.0691 | -1.0607 | |
| 0.06 | 4.12 | 0.9679 | -0.9590 | |
| 0.55 | 6.26 | 1.4728 | -0.7964 | |
| 0.40 | 12.96 | 3.0477 | -0.7636 | |
| 0.23 | 3.09 | 0.7277 | -0.7094 |
13F and Fund Filings
This form was filed on 2025-08-13 for the reporting period 2025-06-30. Click the link icon to see the full transaction history.
Upgrade to unlock premium data and export to Excel ![]() .
.
| Security | Type | Avg Share Price | Shares (MM) |
ΔShares (%) |
ΔShares (%) |
Value ($MM) |
Portfolio (%) |
ΔPortfolio (%) |
|
|---|---|---|---|---|---|---|---|---|---|
| PARR / Par Pacific Holdings, Inc. | 0.66 | -10.65 | 17.51 | 66.24 | 4.1177 | 1.8161 | |||
| SAH / Sonic Automotive, Inc. | 0.18 | -24.68 | 14.30 | 5.69 | 3.3631 | 0.4065 | |||
| DK / Delek US Holdings, Inc. | 0.65 | -11.35 | 13.71 | 24.58 | 3.2240 | 0.8195 | |||
| DINO / HF Sinclair Corporation | 0.32 | -21.64 | 13.07 | -2.09 | 3.0727 | 0.1565 | |||
| TSN / Tyson Foods, Inc. | 0.23 | -21.23 | 13.05 | -30.95 | 3.0691 | -1.0607 | |||
| LUV / Southwest Airlines Co. | 0.40 | -23.09 | 12.96 | -25.70 | 3.0477 | -0.7636 | |||
| ARCB / ArcBest Corporation | 0.16 | 12.54 | 2.9489 | 2.9489 | |||||
| TWI / Titan International, Inc. | 1.21 | -18.22 | 12.46 | 0.10 | 2.9297 | 0.2103 | |||
| AN / AutoNation, Inc. | 0.06 | -20.74 | 12.37 | -2.76 | 2.9095 | 0.1293 | |||
| UAA / Under Armour, Inc. | 1.78 | -20.93 | 12.14 | -13.59 | 2.8550 | -0.2150 | |||
| CBRL / Cracker Barrel Old Country Store, Inc. | 0.20 | -20.75 | 12.10 | 24.68 | 2.8453 | 0.7250 | |||
| ARW / Arrow Electronics, Inc. | 0.09 | -21.70 | 11.87 | -3.90 | 2.7923 | 0.0924 | |||
| FL / Foot Locker, Inc. | 0.47 | -21.05 | 11.50 | 37.18 | 2.7049 | 0.8727 | |||
| GT / The Goodyear Tire & Rubber Company | 1.00 | -6.19 | 10.36 | 5.28 | 2.4371 | 0.2862 | |||
| ASTL / Algoma Steel Group Inc. | 1.46 | -18.79 | 10.08 | 3.24 | 2.3709 | 0.2370 | |||
| WNC / Wabash National Corporation | 0.94 | 22.13 | 10.01 | 17.48 | 2.3551 | 0.4925 | |||
| ABG / Asbury Automotive Group, Inc. | 0.04 | -25.21 | 9.96 | -19.21 | 2.3424 | -0.3519 | |||
| LEA / Lear Corporation | 0.10 | -16.39 | 9.91 | -9.99 | 2.3299 | -0.0752 | |||
| MTUS / Metallus Inc. | 0.64 | -18.18 | 9.81 | -5.63 | 2.3061 | 0.0355 | |||
| RYI / Ryerson Holding Corporation | 0.45 | -17.28 | 9.72 | -22.29 | 2.2864 | -0.4473 | |||
| ALLY / Ally Financial Inc. | 0.25 | -23.12 | 9.67 | -17.89 | 2.2747 | -0.2997 | |||
| AVT / Avnet, Inc. | 0.18 | -18.77 | 9.54 | -10.34 | 2.2428 | -0.0816 | |||
| BLMN / Bloomin' Brands, Inc. | 1.10 | 9.47 | 2.2281 | 2.2281 | |||||
| MEI / Methode Electronics, Inc. | 0.96 | 9.09 | 2.1380 | 2.1380 | |||||
| MGA / Magna International Inc. | 0.23 | -14.99 | 9.06 | -3.44 | 2.1315 | 0.0804 | |||
| WKC / World Kinect Corporation | 0.32 | -20.87 | 9.05 | -20.90 | 2.1283 | -0.3716 | |||
| WOOF / Petco Health and Wellness Company, Inc. | 3.19 | -42.23 | 9.04 | -46.39 | 2.1261 | -1.5592 | |||
| CWK / Cushman & Wakefield plc | 0.81 | 8.99 | 2.1152 | 2.1152 | |||||
| CLW / Clearwater Paper Corporation | 0.33 | 536.92 | 8.89 | 584.06 | 2.0899 | 1.8059 | |||
| BG / Bunge Global SA | 0.11 | -10.05 | 8.70 | -5.50 | 2.0471 | 0.0342 | |||
| AMR / Alpha Metallurgical Resources, Inc. | 0.08 | 71.48 | 8.63 | 54.01 | 2.0301 | 0.8052 | |||
| ALK / Alaska Air Group, Inc. | 0.17 | -25.05 | 8.46 | -24.65 | 1.9888 | -0.4638 | |||
| PBF / PBF Energy Inc. | 0.37 | -15.68 | 7.96 | -4.27 | 1.8713 | 0.0548 | |||
| AAP / Advance Auto Parts, Inc. | 0.17 | -53.13 | 7.70 | -44.43 | 1.8112 | -1.2172 | |||
| DXC / DXC Technology Company | 0.50 | -35.87 | 7.60 | -42.49 | 1.7862 | -1.0997 | |||
| HOV / Hovnanian Enterprises, Inc. | 0.07 | 7.29 | 1.7139 | 1.7139 | |||||
| SNBR / Sleep Number Corporation | 0.97 | 6.59 | 1.5488 | 1.5488 | |||||
| OMI / Owens & Minor, Inc. | 0.72 | -9.31 | 6.58 | -8.61 | 1.5477 | -0.0258 | |||
| LBRT / Liberty Energy Inc. | 0.55 | -16.84 | 6.26 | -39.70 | 1.4728 | -0.7964 | |||
| ADNT / Adient plc | 0.32 | -30.10 | 6.26 | 5.78 | 1.4726 | 0.1790 | |||
| PUMP / ProPetro Holding Corp. | 1.01 | -39.27 | 6.05 | -50.68 | 1.4232 | -1.2578 | |||
| BXC / BlueLinx Holdings Inc. | 0.06 | -52.95 | 4.12 | -53.33 | 0.9679 | -0.9590 | |||
| ZUMZ / Zumiez Inc. | 0.23 | -47.17 | 3.09 | -52.95 | 0.7277 | -0.7094 | |||
| ACI / Albertsons Companies, Inc. | 0.04 | 5.19 | 0.94 | 2.95 | 0.2216 | 0.0215 | |||
| BWA / BorgWarner Inc. | 0.03 | 0.90 | 0.2113 | 0.2113 | |||||
| SEB / Seaboard Corporation | 0.00 | 5.15 | 0.82 | 11.60 | 0.1924 | 0.0321 | |||
| BBY / Best Buy Co., Inc. | 0.01 | 5.23 | 0.78 | -4.05 | 0.1838 | 0.0058 | |||
| TX / Ternium S.A. - Depositary Receipt (Common Stock) | 0.02 | 4.69 | 0.75 | 1.22 | 0.1755 | 0.0143 | |||
| IMKTA / Ingles Markets, Incorporated | 0.01 | 5.21 | 0.68 | 2.43 | 0.1588 | 0.0147 | |||
| KD / Kyndryl Holdings, Inc. | 0.01 | 0.53 | 0.1241 | 0.1241 | |||||
| JELD / JELD-WEN Holding, Inc. | 0.13 | -90.77 | 0.50 | -93.94 | 0.1171 | -1.6793 | |||
| VLO / Valero Energy Corporation | 0.00 | 0.47 | 0.1096 | 0.1096 | |||||
| MAN / ManpowerGroup Inc. | 0.01 | 5.33 | 0.46 | -26.48 | 0.1086 | -0.0286 | |||
| MOH / Molina Healthcare, Inc. | 0.00 | 0.36 | 0.0844 | 0.0844 | |||||
| BCC / Boise Cascade Company | 0.00 | 0.32 | 0.0761 | 0.0761 | |||||
| AEO / American Eagle Outfitters, Inc. | 0.02 | 0.19 | 0.0447 | 0.0447 | |||||
| DAN / Dana Incorporated | 0.00 | -100.00 | 0.00 | 0.0000 | |||||
| CLF / Cleveland-Cliffs Inc. | 0.00 | -100.00 | 0.00 | 0.0000 | |||||
| ULCC / Frontier Group Holdings, Inc. | 0.00 | -100.00 | 0.00 | 0.0000 | |||||
| AXL / American Axle & Manufacturing Holdings, Inc. | 0.00 | -100.00 | 0.00 | 0.0000 | |||||
| UAL / United Airlines Holdings, Inc. | 0.00 | -100.00 | 0.00 | 0.0000 | |||||
| M / Macy's, Inc. | 0.00 | -100.00 | 0.00 | 0.0000 |