Basic Stats
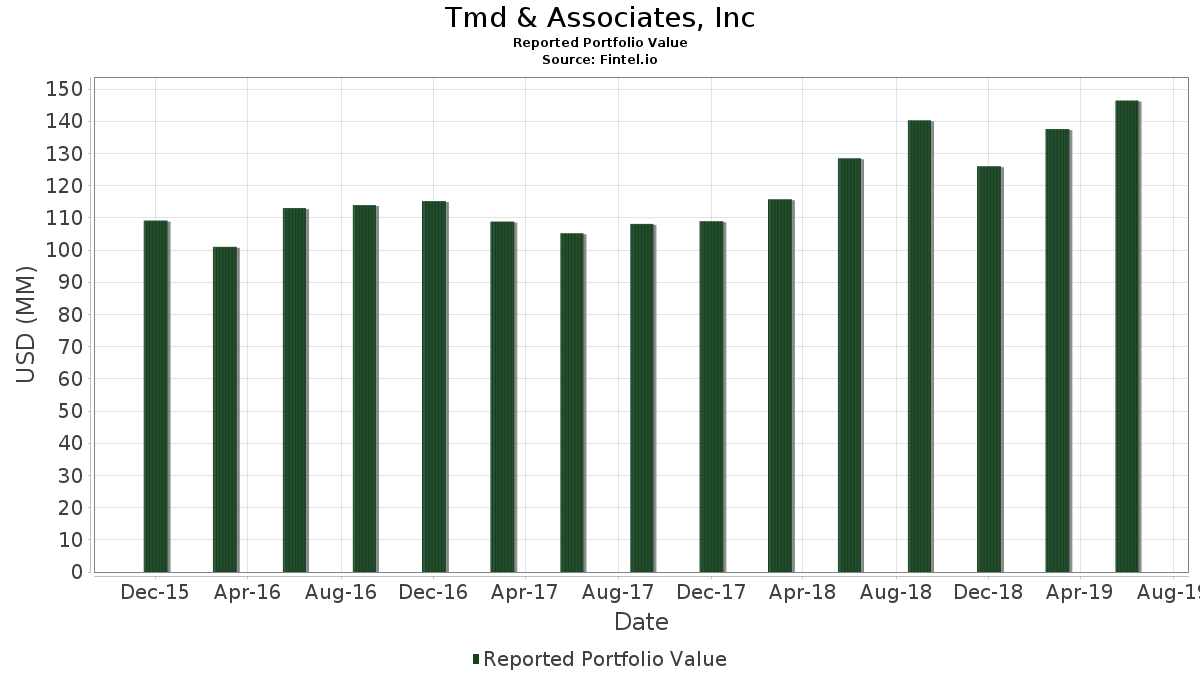
| Portfolio Value | $ 146,410,000 |
| Current Positions | 45 |
Latest Holdings, Performance, AUM (from 13F, 13D)
Tmd & Associates, Inc has disclosed 45 total holdings in their latest SEC filings. Most recent portfolio value is calculated to be $ 146,410,000 USD. Actual Assets Under Management (AUM) is this value plus cash (which is not disclosed). Tmd & Associates, Inc’s top holdings are J.P. Morgan Exchange-Traded Fund Trust - JPMorgan Ultra-Short Income ETF (US:JPST) , Invesco Actively Managed Exchange-Traded Fund Trust - Invesco S&P 500 Downside Hedged ETF (US:PHDG) , SSGA Active Trust - SPDR DoubleLine Total Return Tactical ETF (US:TOTL) , iShares Trust - iShares 7-10 Year Treasury Bond ETF (US:IEF) , and AGF Investments Trust - AGF U.S. Market Neutral Anti-Beta Fund (US:BTAL) . Tmd & Associates, Inc’s new positions include ARK ETF Trust - ARK Innovation ETF (US:ARKK) , Deere & Company (US:DE) , .
Top Increases This Quarter
We use the change in the portfolio allocation because this is the most meaningful metric. Changes can be due to trades or changes in share prices.
| Security | Shares (MM) |
Value (MM$) |
Portfolio % | ΔPortfolio % |
|---|---|---|---|---|
| 0.35 | 17.49 | 11.9445 | 11.9445 | |
| 0.29 | 14.27 | 9.7480 | 9.7480 | |
| 0.08 | 9.23 | 6.3063 | 6.3063 | |
| 0.41 | 9.06 | 6.1895 | 6.1895 | |
| 0.10 | 8.77 | 5.9900 | 5.9900 | |
| 0.29 | 7.52 | 5.1363 | 5.1363 | |
| 0.07 | 7.00 | 4.7777 | 4.7777 | |
| 0.09 | 5.89 | 4.0216 | 4.0216 | |
| 0.12 | 4.92 | 3.3577 | 3.3577 | |
| 0.12 | 4.48 | 3.0606 | 3.0606 |
Top Decreases This Quarter
We use the change in the portfolio allocation because this is the most meaningful metric. Changes can be due to trades or changes in share prices.
| Security | Shares (MM) |
Value (MM$) |
Portfolio % | ΔPortfolio % |
|---|---|---|---|---|
| 0.62 | 17.34 | 11.8407 | -0.8118 | |
| 0.00 | 0.00 | -0.2951 | ||
| 0.03 | 2.36 | 1.6126 | -0.0776 | |
| 0.00 | 0.44 | 0.3005 | -0.0470 | |
| 0.13 | 8.06 | 5.5024 | -0.0348 | |
| 0.00 | 0.23 | 0.1578 | -0.0290 | |
| 0.01 | 0.30 | 0.2056 | -0.0205 | |
| 0.00 | 0.22 | 0.1530 | -0.0186 | |
| 0.00 | 0.34 | 0.2356 | -0.0166 | |
| 0.00 | 0.31 | 0.2138 | -0.0145 |
13F and Fund Filings
This form was filed on 2019-08-09 for the reporting period 2019-06-30. Click the link icon to see the full transaction history.
Upgrade to unlock premium data and export to Excel ![]() .
.