Basic Stats
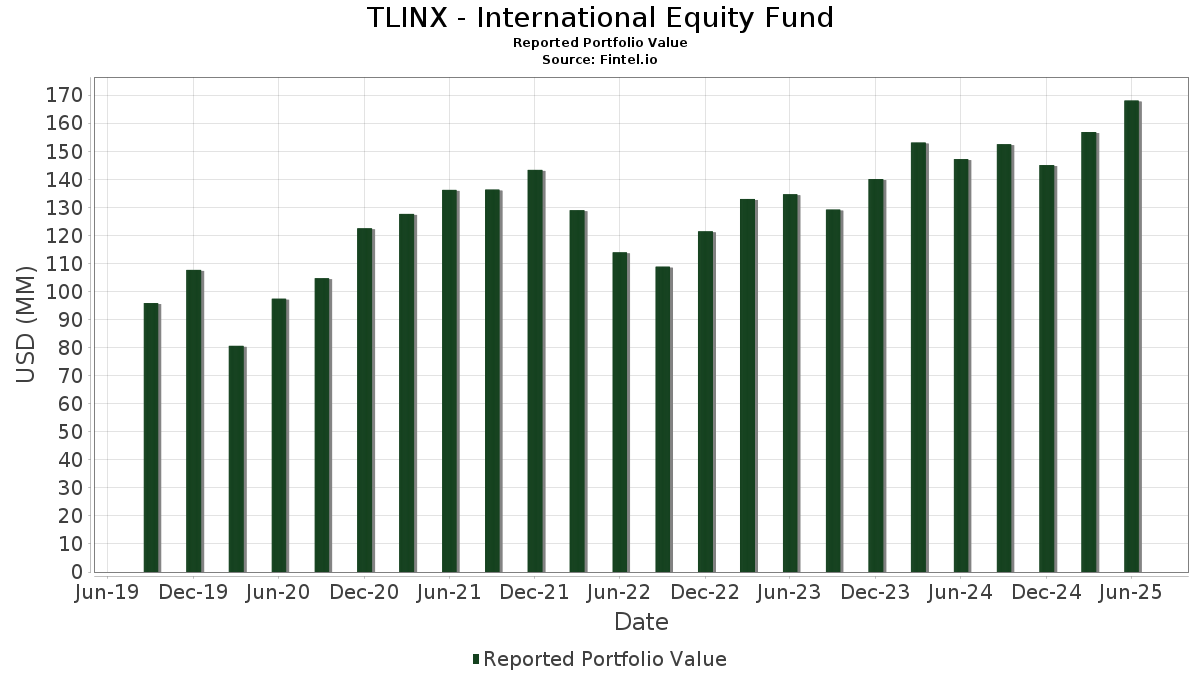
| Portfolio Value | $ 168,058,810 |
| Current Positions | 71 |
Latest Holdings, Performance, AUM (from 13F, 13D)
TLINX - International Equity Fund has disclosed 71 total holdings in their latest SEC filings. Most recent portfolio value is calculated to be $ 168,058,810 USD. Actual Assets Under Management (AUM) is this value plus cash (which is not disclosed). TLINX - International Equity Fund’s top holdings are Hitachi, Ltd. (JP:6501) , Siemens Aktiengesellschaft (DE:SIE) , Airbus SE (DE:AIR) , Mitsubishi UFJ Financial Group, Inc. (JP:8306) , and Nintendo Co., Ltd. (JP:7974) . TLINX - International Equity Fund’s new positions include Mitsubishi Electric Corporation (JP:6503) , L'Air Liquide S.A. (FR:AI) , Fujitsu Limited (JP:6702) , National Grid PLC (GB:NG/) , and .
Top Increases This Quarter
We use the change in the portfolio allocation because this is the most meaningful metric. Changes can be due to trades or changes in share prices.
| Security | Shares (MM) |
Value (MM$) |
Portfolio % | ΔPortfolio % |
|---|---|---|---|---|
| 4.37 | 2.6037 | 2.6037 | ||
| 0.12 | 2.50 | 1.4872 | 1.4872 | |
| 0.01 | 2.29 | 1.3659 | 1.3659 | |
| 0.00 | 4.28 | 2.5476 | 1.0761 | |
| 0.07 | 1.60 | 0.9535 | 0.9535 | |
| 0.10 | 1.48 | 0.8809 | 0.8809 | |
| 0.12 | 2.25 | 1.3400 | 0.6151 | |
| 1.00 | 0.5949 | 0.5949 | ||
| 0.05 | 4.57 | 2.7245 | 0.5507 | |
| 0.03 | 2.05 | 1.2185 | 0.3907 |
Top Decreases This Quarter
We use the change in the portfolio allocation because this is the most meaningful metric. Changes can be due to trades or changes in share prices.
| Security | Shares (MM) |
Value (MM$) |
Portfolio % | ΔPortfolio % |
|---|---|---|---|---|
| 0.08 | 1.41 | 0.8371 | -1.3387 | |
| 0.00 | 0.00 | 0.0002 | -1.3052 | |
| 0.13 | 3.27 | 1.9495 | -1.1461 | |
| 0.02 | 3.17 | 1.8855 | -0.7918 | |
| 0.02 | 0.69 | 0.4088 | -0.4921 | |
| 0.00 | 2.35 | 1.4016 | -0.4566 | |
| 0.12 | 4.27 | 2.5430 | -0.4513 | |
| 0.00 | 2.18 | 1.2995 | -0.4354 | |
| 0.01 | 3.44 | 2.0504 | -0.3780 | |
| 0.36 | 4.91 | 2.9271 | -0.3774 |
13F and Fund Filings
This form was filed on 2025-08-28 for the reporting period 2025-06-30. Click the link icon to see the full transaction history.
Upgrade to unlock premium data and export to Excel ![]() .
.
| Security | Type | Avg Share Price | Shares (MM) |
ΔShares (%) |
ΔShares (%) |
Value ($MM) |
Portfolio (%) |
ΔPortfolio (%) |
|
|---|---|---|---|---|---|---|---|---|---|
| 6501 / Hitachi, Ltd. | 0.21 | -4.75 | 6.12 | 17.90 | 3.6445 | 0.3210 | |||
| SIE / Siemens Aktiengesellschaft | 0.02 | -4.73 | 5.13 | 5.95 | 3.0545 | -0.0450 | |||
| AIR / Airbus SE | 0.02 | -4.73 | 5.05 | 13.20 | 3.0082 | 0.1506 | |||
| 8306 / Mitsubishi UFJ Financial Group, Inc. | 0.36 | -4.76 | 4.91 | -4.77 | 2.9271 | -0.3774 | |||
| 7974 / Nintendo Co., Ltd. | 0.05 | -4.61 | 4.57 | 34.77 | 2.7245 | 0.5507 | |||
| BK / The Bank of New York Mellon Corporation - Depositary Receipt (Common Stock) | 4.37 | 2.6037 | 2.6037 | ||||||
| BBVA / Banco Bilbao Vizcaya Argentaria, S.A. | 0.28 | -4.73 | 4.32 | 7.50 | 2.5709 | -0.0007 | |||
| RHM / Rheinmetall AG | 0.00 | 25.78 | 4.28 | 86.12 | 2.5476 | 1.0761 | |||
| G80827101 / Shell PLC | 0.12 | -4.73 | 4.27 | -8.70 | 2.5430 | -0.4513 | |||
| 6758 / Sony Group Corporation | 0.16 | -4.78 | 4.15 | -2.15 | 2.4691 | -0.2441 | |||
| NVO / Novo Nordisk A/S - Depositary Receipt (Common Stock) | 0.06 | -4.73 | 4.02 | -3.44 | 2.3912 | -0.2719 | |||
| CBA / Commonwealth Bank of Australia | 0.03 | -4.73 | 3.91 | 21.95 | 2.3300 | 0.2754 | |||
| EL / EssilorLuxottica Société anonyme | 0.01 | -4.73 | 3.44 | -9.23 | 2.0504 | -0.3780 | |||
| BNC / Banco Santander, S.A. | 0.41 | -4.73 | 3.42 | 17.13 | 2.0363 | 0.1666 | |||
| CRH / CRH plc | 0.04 | -4.73 | 3.37 | -0.59 | 2.0054 | -0.1635 | |||
| HEI / Heidelberg Materials AG | 0.01 | -4.73 | 3.28 | 30.14 | 1.9519 | 0.3394 | |||
| 8316 / Sumitomo Mitsui Financial Group, Inc. | 0.13 | -30.85 | 3.27 | -32.29 | 1.9495 | -1.1461 | |||
| HLN / Haleon plc - Depositary Receipt (Common Stock) | 0.63 | -4.73 | 3.26 | -3.04 | 1.9406 | -0.2115 | |||
| AZN / AstraZeneca PLC | 0.02 | -20.10 | 3.17 | -24.28 | 1.8855 | -0.7918 | |||
| ULVR / Unilever PLC | 0.05 | -4.73 | 3.04 | -2.56 | 1.8134 | -0.1876 | |||
| INGA / ING Groep N.V. | 0.13 | -4.73 | 2.95 | 6.59 | 1.7542 | -0.0155 | |||
| ZURN / Zurich Insurance Group AG | 0.00 | 4.24 | 2.94 | 4.48 | 1.7502 | -0.0506 | |||
| DS81 / DSV A/S | 0.01 | -4.73 | 2.88 | 18.19 | 1.7150 | 0.1545 | |||
| ROG / Roche Holding AG | 0.01 | -4.72 | 2.83 | -5.51 | 1.6856 | -0.2324 | |||
| LIN / Linde plc | 0.01 | -4.72 | 2.66 | -4.00 | 1.5857 | -0.1902 | |||
| SAPGF / SAP SE | 0.01 | -4.72 | 2.60 | 8.76 | 1.5461 | 0.0171 | |||
| 6503 / Mitsubishi Electric Corporation | 0.12 | 2.50 | 1.4872 | 1.4872 | |||||
| BATS / British American Tobacco p.l.c. | 0.05 | 2,189.23 | 2.49 | 20.96 | 1.4812 | 0.0894 | |||
| 4568 / Daiichi Sankyo Company, Limited | 0.10 | -4.76 | 2.37 | -7.33 | 1.4087 | -0.2260 | |||
| ASML / ASML Holding N.V. | 0.00 | -33.02 | 2.35 | -18.89 | 1.4016 | -0.4566 | |||
| AI / L'Air Liquide S.A. | 0.01 | 2.29 | 1.3659 | 1.3659 | |||||
| IBE / Iberdrola, S.A. | 0.12 | 88.95 | 2.25 | 152.98 | 1.3400 | 0.6151 | |||
| DG / Vinci SA | 0.02 | -4.72 | 2.22 | 11.48 | 1.3248 | 0.0468 | |||
| X5S8VL105 / Nordea Bank Abp | 0.15 | -4.73 | 2.22 | 10.56 | 1.3216 | 0.0358 | |||
| MC / LVMH Moët Hennessy - Louis Vuitton, Société Européenne | 0.00 | -4.71 | 2.18 | -19.49 | 1.2995 | -0.4354 | |||
| BARC / Barclays PLC | 0.47 | -4.73 | 2.17 | 17.08 | 1.2947 | 0.1057 | |||
| KPN / Koninklijke KPN N.V. | 0.44 | -4.73 | 2.15 | 9.70 | 1.2803 | 0.0257 | |||
| BHP / BHP Group Limited | 0.09 | -4.73 | 2.11 | -5.50 | 1.2579 | -0.1739 | |||
| LONN / Lonza Group AG | 0.00 | 27.92 | 2.08 | 48.15 | 1.2390 | 0.3394 | |||
| 6857 / Advantest Corporation | 0.03 | -4.83 | 2.05 | 58.36 | 1.2185 | 0.3907 | |||
| CFR / Compagnie Financière Richemont SA | 0.01 | -4.73 | 2.03 | 3.31 | 1.2066 | -0.0496 | |||
| FP / TOTAL SA | 0.03 | -4.73 | 2.01 | -9.66 | 1.1981 | -0.2273 | |||
| HEIA / Heineken N.V. | 0.02 | -4.73 | 1.92 | 1.91 | 1.1422 | -0.0626 | |||
| SW / Smurfit Westrock Plc | 0.04 | -4.73 | 1.91 | -8.74 | 1.1376 | -0.2031 | |||
| SGO / Compagnie de Saint-Gobain S.A. | 0.02 | -4.73 | 1.89 | 12.37 | 1.1257 | 0.0484 | |||
| CRIN / UniCredit S.p.A. | 0.03 | -4.73 | 1.87 | 13.85 | 1.1116 | 0.0618 | |||
| GLEN / Glencore PLC | 0.44 | -4.73 | 1.70 | 1.43 | 1.0108 | -0.0608 | |||
| MONC / Moncler S.p.A. | 0.03 | -4.73 | 1.69 | -11.81 | 1.0051 | -0.2199 | |||
| ITUB20 / Itau Unibanco Holding SA | 0.25 | -4.75 | 1.68 | 17.70 | 0.9985 | 0.0862 | |||
| RWE / RWE Aktiengesellschaft | 0.04 | 0.00 | 1.66 | 17.08 | 0.9882 | 0.0804 | |||
| TSM / Taiwan Semiconductor Manufacturing Company Limited - Depositary Receipt (Common Stock) | 0.01 | -4.72 | 1.63 | 29.96 | 0.9719 | 0.1680 | |||
| 6702 / Fujitsu Limited | 0.07 | 1.60 | 0.9535 | 0.9535 | |||||
| ENEL / Enel SpA | 0.16 | 0.00 | 1.50 | 17.11 | 0.8930 | 0.0729 | |||
| NG/ / National Grid PLC | 0.10 | 1.48 | 0.8809 | 0.8809 | |||||
| TM / Toyota Motor Corporation - Depositary Receipt (Common Stock) | 0.08 | -57.54 | 1.41 | -58.64 | 0.8371 | -1.3387 | |||
| SSNLF / Samsung Electronics Co., Ltd. | 0.03 | -4.73 | 1.36 | 6.25 | 0.8109 | -0.0096 | |||
| DPW / Deutsche Post AG - Depositary Receipt (Common Stock) | 0.03 | -4.73 | 1.34 | 2.77 | 0.7966 | -0.0367 | |||
| NESN / Nestlé S.A. | 0.01 | -4.73 | 1.08 | -6.33 | 0.6444 | -0.0948 | |||
| 8591 / ORIX Corporation | 0.05 | -32.32 | 1.06 | -26.83 | 0.6303 | -0.2962 | |||
| TVC / Tennessee Valley Authority - Preferred Stock | 1.00 | 0.5949 | 0.5949 | ||||||
| NOVN / Novartis AG | 0.01 | -4.72 | 0.86 | 4.11 | 0.5140 | -0.0168 | |||
| KER / Kering SA | 0.00 | -4.71 | 0.80 | -0.25 | 0.4746 | -0.0368 | |||
| HDB / HDFC Bank Limited - Depositary Receipt (Common Stock) | 0.01 | -4.73 | 0.75 | 9.94 | 0.4481 | 0.0099 | |||
| RELIANCE / Reliance Industries Limited | 0.04 | -4.73 | 0.69 | 12.20 | 0.4110 | 0.0170 | |||
| FMX / Fomento Económico Mexicano, S.A.B. de C.V. - Depositary Receipt (Common Stock) | 0.01 | -4.72 | 0.69 | 0.44 | 0.4109 | -0.0285 | |||
| 8473 / SBI Holdings, Inc. | 0.02 | -62.19 | 0.69 | -51.21 | 0.4088 | -0.4921 | |||
| BP / BP p.l.c. - Depositary Receipt (Common Stock) | 0.14 | -4.73 | 0.69 | -15.41 | 0.4087 | -0.1108 | |||
| GFNORTE / Grupo Financiero Banorte SAB de CV | 0.07 | -4.76 | 0.60 | 25.63 | 0.3593 | 0.0515 | |||
| RB/ / Reckitt Benckiser Group PLC | 0.01 | -4.72 | 0.45 | -4.03 | 0.2693 | -0.0324 | |||
| BBRI / PT Bank Rakyat Indonesia (Persero) Tbk | 1.74 | -4.73 | 0.40 | -9.28 | 0.2393 | -0.0439 | |||
| US8575093013 / State Street Navigator Securities Lending Government Money Market Portfolio | 0.00 | -99.98 | 0.00 | -100.00 | 0.0002 | -1.3052 |