Basic Stats
| Portfolio Value | $ 240,759,000 |
| Current Positions | 19 |
Latest Holdings, Performance, AUM (from 13F, 13D)
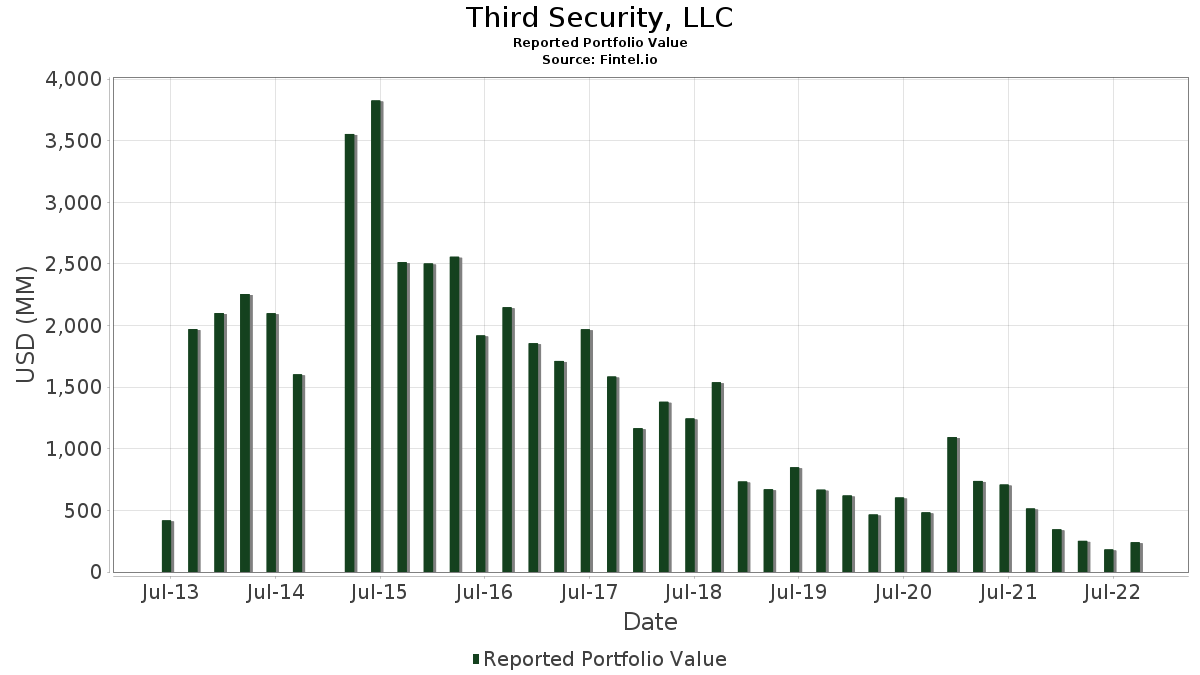
Third Security, LLC has disclosed 19 total holdings in their latest SEC filings. Most recent portfolio value is calculated to be $ 240,759,000 USD. Actual Assets Under Management (AUM) is this value plus cash (which is not disclosed). Third Security, LLC’s top holdings are Precigen, Inc. (US:PGEN) , Kinder Morgan, Inc. (US:KMI) , AbbVie Inc. (US:ABBV) , International Business Machines Corporation (US:IBM) , and Apple Inc. (US:AAPL) .
Top Increases This Quarter
We use the change in the portfolio allocation because this is the most meaningful metric. Changes can be due to trades or changes in share prices.
| Security | Shares (MM) |
Value (MM$) |
Portfolio % | ΔPortfolio % |
|---|---|---|---|---|
| 83.47 | 176.95 | 73.4955 | 12.0596 | |
| 0.04 | 5.17 | 2.1465 | 0.7118 |
Top Decreases This Quarter
We use the change in the portfolio allocation because this is the most meaningful metric. Changes can be due to trades or changes in share prices.
| Security | Shares (MM) |
Value (MM$) |
Portfolio % | ΔPortfolio % |
|---|---|---|---|---|
| 5.29 | 4.13 | 1.7154 | -3.3013 | |
| 0.04 | 5.18 | 2.1519 | -1.0955 | |
| 0.12 | 4.54 | 1.8861 | -1.0856 | |
| 0.02 | 4.66 | 1.9347 | -0.8870 | |
| 0.04 | 4.23 | 1.7574 | -0.8859 | |
| 0.32 | 5.26 | 2.1839 | -0.7252 | |
| 0.11 | 4.52 | 1.8786 | -0.6910 | |
| 0.04 | 4.93 | 2.0494 | -0.6318 | |
| 0.04 | 2.76 | 1.1480 | -0.6053 | |
| 0.02 | 1.80 | 0.7481 | -0.4395 |
13F and Fund Filings
This form was filed on 2022-11-14 for the reporting period 2022-09-30. Click the link icon to see the full transaction history.
Upgrade to unlock premium data and export to Excel ![]() .
.
| Security | Type | Avg Share Price | Shares (MM) |
ΔShares (%) |
ΔShares (%) |
Value ($MM) |
Portfolio (%) |
ΔPortfolio (%) |
|
|---|---|---|---|---|---|---|---|---|---|
| PGEN / Precigen, Inc. | 83.47 | 0.00 | 176.95 | 58.21 | 73.4955 | 12.0596 | |||
| KMI / Kinder Morgan, Inc. | 0.32 | 0.00 | 5.26 | -0.72 | 2.1839 | -0.7252 | |||
| ABBV / AbbVie Inc. | 0.04 | 0.00 | 5.18 | -12.36 | 2.1519 | -1.0955 | |||
| IBM / International Business Machines Corporation | 0.04 | 135.14 | 5.17 | 97.86 | 2.1465 | 0.7118 | |||
| AAPL / Apple Inc. | 0.04 | 0.00 | 4.93 | 1.09 | 2.0494 | -0.6318 | |||
| MSFT / Microsoft Corporation | 0.02 | 0.00 | 4.66 | -9.32 | 1.9347 | -0.8870 | |||
| VZ / Verizon Communications Inc. | 0.12 | 12.20 | 4.54 | -16.06 | 1.8861 | -1.0856 | |||
| MO / Altria Group, Inc. | 0.11 | 0.00 | 4.52 | -3.31 | 1.8786 | -0.6910 | |||
| GOOGL / Alphabet Inc. | 0.04 | 1,900.00 | 4.23 | -12.07 | 1.7574 | -0.8859 | |||
| AQB / AquaBounty Technologies, Inc. | 5.29 | -0.97 | 4.13 | -54.78 | 1.7154 | -3.3013 | |||
| CVX / Chevron Corporation | 0.02 | 5.00 | 3.02 | 4.18 | 1.2531 | -0.3377 | |||
| AMZN / Amazon.com, Inc. | 0.03 | 0.00 | 2.94 | 6.41 | 1.2203 | -0.2963 | |||
| D / Dominion Energy, Inc. | 0.04 | 0.00 | 2.76 | -13.41 | 1.1480 | -0.6053 | |||
| MRK / Merck & Co., Inc. | 0.03 | 0.00 | 2.64 | -5.54 | 1.0982 | -0.4393 | |||
| PNC / The PNC Financial Services Group, Inc. | 0.02 | 0.00 | 2.39 | -5.27 | 0.9931 | -0.3933 | |||
| XOM / Exxon Mobil Corporation | 0.03 | 0.00 | 2.38 | 1.97 | 0.9902 | -0.2941 | |||
| DOW / Dow Inc. | 0.04 | 0.00 | 1.84 | -14.85 | 0.7647 | -0.4229 | |||
| KMB / Kimberly-Clark Corporation | 0.02 | 0.00 | 1.80 | -16.70 | 0.7481 | -0.4395 | |||
| CSCO / Cisco Systems, Inc. | 0.04 | 0.00 | 1.41 | -6.20 | 0.5848 | -0.2397 |