Basic Stats
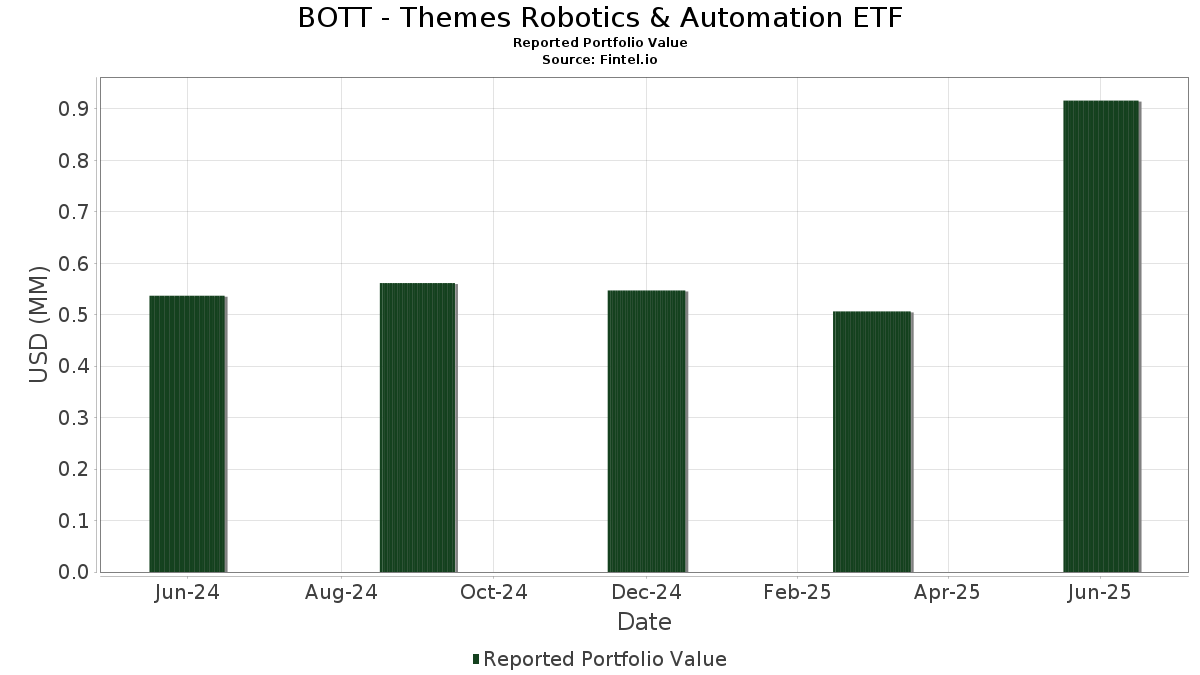
| Portfolio Value | $ 916,294 |
| Current Positions | 32 |
Latest Holdings, Performance, AUM (from 13F, 13D)
BOTT - Themes Robotics & Automation ETF has disclosed 32 total holdings in their latest SEC filings. Most recent portfolio value is calculated to be $ 916,294 USD. Actual Assets Under Management (AUM) is this value plus cash (which is not disclosed). BOTT - Themes Robotics & Automation ETF’s top holdings are Credo Technology Group Holding Ltd (US:CRDO) , Semtech Corporation (US:SMTC) , Ambarella, Inc. (US:AMBA) , MACOM Technology Solutions Holdings, Inc. (US:MTSI) , and The Japan Steel Works, Ltd. (JP:5631) . BOTT - Themes Robotics & Automation ETF’s new positions include Okuma Corporation (JP:6103) , Kennametal Inc. (US:KMT) , Ralliant Corporation (US:RAL) , .
Top Increases This Quarter
We use the change in the portfolio allocation because this is the most meaningful metric. Changes can be due to trades or changes in share prices.
| Security | Shares (MM) |
Value (MM$) |
Portfolio % | ΔPortfolio % |
|---|---|---|---|---|
| 0.00 | 0.06 | 6.2305 | 4.2807 | |
| 0.00 | 0.03 | 3.3300 | 3.3300 | |
| 0.00 | 0.03 | 3.1275 | 3.1275 | |
| 0.01 | 0.03 | 2.9428 | 2.9428 | |
| 0.00 | 0.04 | 4.4383 | 2.5856 | |
| 0.00 | 0.04 | 3.9061 | 1.4724 | |
| 0.00 | 0.03 | 3.7601 | 1.0373 | |
| 0.00 | 0.03 | 3.3345 | 0.8236 | |
| 0.00 | 0.03 | 3.6642 | 0.8096 | |
| 0.00 | 0.01 | 0.6441 | 0.6441 |
Top Decreases This Quarter
We use the change in the portfolio allocation because this is the most meaningful metric. Changes can be due to trades or changes in share prices.
| Security | Shares (MM) |
Value (MM$) |
Portfolio % | ΔPortfolio % |
|---|---|---|---|---|
| 0.00 | 0.00 | -2.5724 | ||
| 0.00 | 0.02 | 2.6109 | -1.9772 | |
| 0.00 | 0.02 | 2.7165 | -1.5505 | |
| 0.00 | 0.02 | 2.0775 | -1.4323 | |
| 0.00 | 0.03 | 3.0704 | -1.3851 | |
| 0.00 | 0.02 | 1.8368 | -1.3820 | |
| 0.00 | 0.03 | 3.0957 | -1.1998 | |
| 0.00 | 0.03 | 2.8449 | -1.1661 | |
| 0.00 | 0.02 | 2.5924 | -0.9836 | |
| 0.00 | 0.02 | 2.7171 | -0.9239 |
13F and Fund Filings
This form was filed on 2025-08-27 for the reporting period 2025-06-30. Click the link icon to see the full transaction history.
Upgrade to unlock premium data and export to Excel ![]() .
.
| Security | Type | Avg Share Price | Shares (MM) |
ΔShares (%) |
ΔShares (%) |
Value ($MM) |
Portfolio (%) |
ΔPortfolio (%) |
|
|---|---|---|---|---|---|---|---|---|---|
| CRDO / Credo Technology Group Holding Ltd | 0.00 | 150.20 | 0.06 | 533.33 | 6.2305 | 4.2807 | |||
| SMTC / Semtech Corporation | 0.00 | 229.56 | 0.04 | 344.44 | 4.4383 | 2.5856 | |||
| AMBA / Ambarella, Inc. | 0.00 | 120.73 | 0.04 | 191.67 | 3.9061 | 1.4724 | |||
| MTSI / MACOM Technology Solutions Holdings, Inc. | 0.00 | 74.64 | 0.03 | 161.54 | 3.7601 | 1.0373 | |||
| 5631 / The Japan Steel Works, Ltd. | 0.00 | 20.00 | 0.03 | 100.00 | 3.7523 | 0.3215 | |||
| ROK / Rockwell Automation, Inc. | 0.00 | 63.49 | 0.03 | 100.00 | 3.7254 | 0.5068 | |||
| TYIDY / Toyota Industries Corporation - Depositary Receipt (Common Stock) | 0.00 | 50.00 | 0.03 | 106.25 | 3.6975 | 0.3675 | |||
| NVDA / NVIDIA Corporation | 0.00 | 58.96 | 0.03 | 135.71 | 3.6642 | 0.8096 | |||
| 6841 / Yokogawa Electric Corporation | 0.00 | 33.33 | 0.03 | 88.24 | 3.4978 | 0.0857 | |||
| KCR / Konecranes Plc | 0.00 | 37.46 | 0.03 | 72.22 | 3.4554 | -0.1814 | |||
| H11 / Halma plc | 0.00 | 26.16 | 0.03 | 72.22 | 3.3910 | -0.2920 | |||
| ANDR / Andritz AG | 0.00 | 51.47 | 0.03 | 130.77 | 3.3345 | 0.8236 | |||
| 6103 / Okuma Corporation | 0.00 | 0.03 | 3.3300 | 3.3300 | |||||
| FANUY / Fanuc Corporation - Depositary Receipt (Common Stock) | 0.00 | 57.14 | 0.03 | 66.67 | 3.2770 | -0.4474 | |||
| JBTM / JBT Marel Corporation | 0.00 | 65.56 | 0.03 | 66.67 | 3.2737 | -0.3533 | |||
| KMT / Kennametal Inc. | 0.00 | 0.03 | 3.1275 | 3.1275 | |||||
| VALMT / Valmet Oyj | 0.00 | 44.15 | 0.03 | 40.00 | 3.1134 | -0.5345 | |||
| AA2 / Amada Co., Ltd. | 0.00 | 30.00 | 0.03 | 47.37 | 3.0973 | -0.6966 | |||
| 6383 / Daifuku Co., Ltd. | 0.00 | 22.22 | 0.03 | 33.33 | 3.0957 | -1.1998 | |||
| HEXAB / Hexagon AB | 0.00 | 52.08 | 0.03 | 64.71 | 3.0830 | -0.1314 | |||
| G1A / GEA Group Aktiengesellschaft | 0.00 | 7.47 | 0.03 | 27.27 | 3.0704 | -1.3851 | |||
| 1882 / Haitian International Holdings Limited | 0.01 | 0.03 | 2.9428 | 2.9428 | |||||
| QCOM / QUALCOMM Incorporated | 0.00 | 45.69 | 0.03 | 52.94 | 2.9307 | -0.5718 | |||
| TDY / Teledyne Technologies Incorporated | 0.00 | 24.39 | 0.03 | 30.00 | 2.8449 | -1.1661 | |||
| ESAB / ESAB Corporation | 0.00 | 30.19 | 0.02 | 33.33 | 2.7171 | -0.9239 | |||
| 7732 / Topcon Corporation | 0.00 | 10.00 | 0.02 | 14.29 | 2.7165 | -1.5505 | |||
| 6135 / Makino Milling Machine Co., Ltd. | 0.00 | 0.00 | 0.02 | 0.00 | 2.6109 | -1.9772 | |||
| KAI / Kadant Inc. | 0.00 | 38.89 | 0.02 | 27.78 | 2.5924 | -0.9836 | |||
| FTV / Fortive Corporation | 0.00 | 50.00 | 0.02 | 11.76 | 2.0775 | -1.4323 | |||
| 6861 / Keyence Corporation | 0.00 | 0.00 | 0.02 | 0.00 | 1.8368 | -1.3820 | |||
| RAL / Ralliant Corporation | 0.00 | 0.01 | 0.6441 | 0.6441 | |||||
| FXFXX / First American Funds Inc - First American Treasury Obligations Fund Class X | 0.00 | 378.14 | 0.00 | 300.00 | 0.5384 | 0.3351 | |||
| 6526 / Socionext Inc. | 0.00 | -100.00 | 0.00 | -100.00 | -2.5724 |