Basic Stats
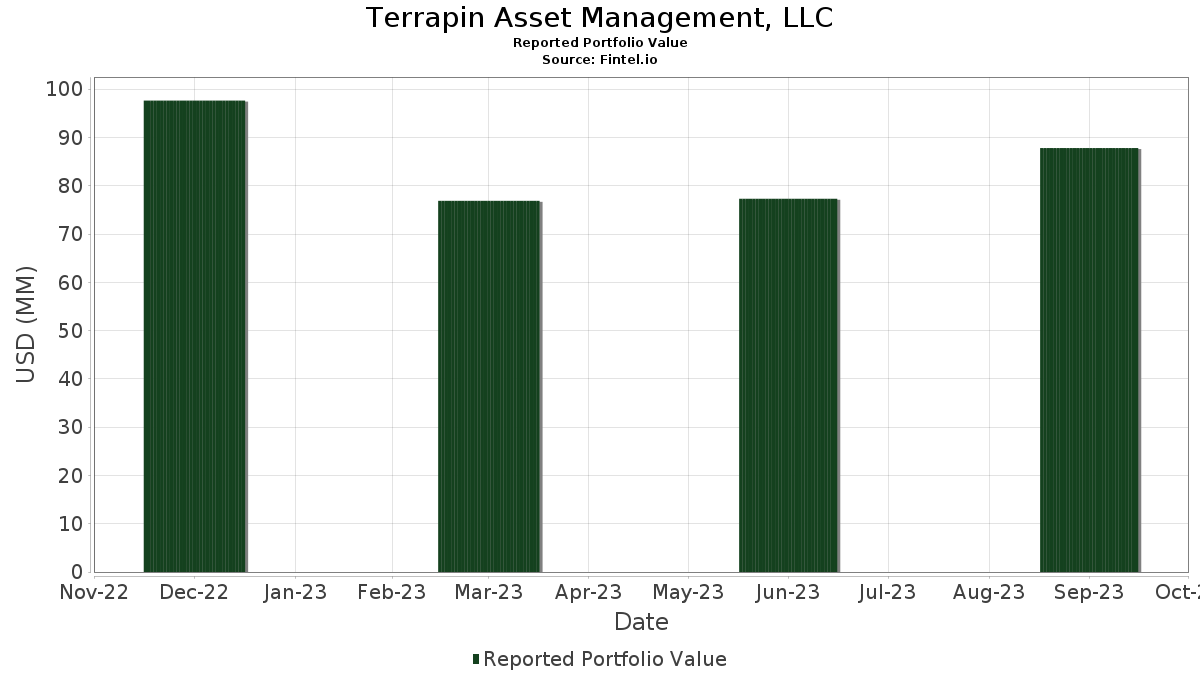
| Portfolio Value | $ 87,813,672 |
| Current Positions | 52 |
Latest Holdings, Performance, AUM (from 13F, 13D)
Terrapin Asset Management, LLC has disclosed 52 total holdings in their latest SEC filings. Most recent portfolio value is calculated to be $ 87,813,672 USD. Actual Assets Under Management (AUM) is this value plus cash (which is not disclosed). Terrapin Asset Management, LLC’s top holdings are Seagen Inc (US:SGEN) , iShares Trust - iShares 20+ Year Treasury Bond ETF (US:TLT) , Alphabet Inc. (US:GOOGL) , Screaming Eagle Acquisition Corp. (US:SCRM) , and The Select Sector SPDR Trust - The Energy Select Sector SPDR Fund (US:XLE) . Terrapin Asset Management, LLC’s new positions include Seagen Inc (US:SGEN) , Seagen Inc (US:SGEN) , Zoetis Inc. (US:ZTS) , Berkeley Lights Inc (US:BLI) , and HomeStreet, Inc. (US:HMST) .
Top Increases This Quarter
We use the change in the portfolio allocation because this is the most meaningful metric. Changes can be due to trades or changes in share prices.
| Security | Shares (MM) |
Value (MM$) |
Portfolio % | ΔPortfolio % |
|---|---|---|---|---|
| 0.04 | 8.53 | 9.7120 | 9.7120 | |
| 0.05 | 4.52 | 5.1467 | 4.6427 | |
| 0.09 | 7.98 | 9.0898 | 3.7638 | |
| 0.01 | 2.97 | 3.3823 | 3.3823 | |
| 0.01 | 2.61 | 2.9719 | 2.9719 | |
| 2.11 | 2.11 | 2.3981 | 2.3981 | |
| 0.25 | 1.93 | 2.1931 | 2.1931 | |
| 0.17 | 1.70 | 1.9383 | 1.9383 | |
| 0.10 | 1.07 | 1.2242 | 1.2242 | |
| 0.56 | 0.86 | 0.9800 | 0.9800 |
Top Decreases This Quarter
We use the change in the portfolio allocation because this is the most meaningful metric. Changes can be due to trades or changes in share prices.
| Security | Shares (MM) |
Value (MM$) |
Portfolio % | ΔPortfolio % |
|---|---|---|---|---|
| 0.00 | 0.00 | -3.2712 | ||
| 0.00 | 0.00 | -2.8862 | ||
| 0.00 | 0.00 | -2.7972 | ||
| 0.02 | 1.36 | 1.5502 | -2.5486 | |
| 0.00 | 0.00 | -2.4162 | ||
| 0.00 | 0.00 | -1.9242 | ||
| 0.52 | 4.09 | 4.6619 | -1.8338 | |
| 0.00 | 0.00 | -1.7692 | ||
| 0.04 | 1.80 | 2.0442 | -1.5750 | |
| 0.00 | 0.00 | -1.2287 |
13F and Fund Filings
This form was filed on 2023-11-14 for the reporting period 2023-09-30. Click the link icon to see the full transaction history.
Upgrade to unlock premium data and export to Excel ![]() .
.
| Security | Type | Avg Share Price | Shares (MM) |
ΔShares (%) |
ΔShares (%) |
Value ($MM) |
Portfolio (%) |
ΔPortfolio (%) |
|
|---|---|---|---|---|---|---|---|---|---|
| SGEN / Seagen Inc | Put | 0.04 | 8.53 | 9.7120 | 9.7120 | ||||
| TLT / iShares Trust - iShares 20+ Year Treasury Bond ETF | 0.09 | 125.00 | 7.98 | 93.88 | 9.0898 | 3.7638 | |||
| GOOGL / Alphabet Inc. | 0.05 | 7.88 | 6.45 | 17.93 | 7.3467 | 0.2710 | |||
| SCRM / Screaming Eagle Acquisition Corp. | 0.60 | 0.00 | 6.27 | 1.36 | 7.1424 | -0.8617 | |||
| XLE / The Select Sector SPDR Trust - The Energy Select Sector SPDR Fund | 0.05 | 941.67 | 4.52 | 1,061.70 | 5.1467 | 4.6427 | |||
| CCIF / Carlyle Credit Income Fund | 0.53 | 12.20 | 4.34 | -7.72 | 4.9451 | -1.1413 | |||
| LGF.B / Lions Gate Entertainment Corp. | 0.52 | -13.51 | 4.09 | -18.48 | 4.6619 | -1.8338 | |||
| SCU / Sculptor Capital Management Inc - Class A | 0.32 | -19.09 | 3.73 | 6.31 | 4.2427 | -0.2908 | |||
| BTWN / Bridgetown Holdings Ltd - Class A | 0.35 | -11.79 | 3.66 | -11.03 | 4.1700 | -1.1529 | |||
| ZTS / Zoetis Inc. | 0.02 | 45.83 | 3.04 | 47.34 | 3.4672 | 0.7942 | |||
| SGEN / Seagen Inc | 0.01 | 2.97 | 3.3823 | 3.3823 | |||||
| ZTS / Zoetis Inc. | Put | 0.01 | 2.61 | 2.9719 | 2.9719 | ||||
| FHN / First Horizon Corporation | 0.21 | -13.48 | 2.33 | -15.37 | 2.6579 | -0.9106 | |||
| BLI / Berkeley Lights Inc | 2.11 | 2.11 | 2.3981 | 2.3981 | |||||
| HMST / HomeStreet, Inc. | 0.25 | 1.93 | 2.1931 | 2.1931 | |||||
| CZFS / Citizens Financial Services, Inc. | 0.04 | -0.30 | 1.80 | -35.85 | 2.0442 | -1.5750 | |||
| IPXX / Inflection Point Acquisition Corp. II | 0.17 | 1.70 | 1.9383 | 1.9383 | |||||
| GMED / Globus Medical, Inc. | 0.03 | 20.07 | 1.66 | 0.12 | 1.8934 | -0.2545 | |||
| SPB / Spectrum Brands Holdings, Inc. | 0.02 | -57.21 | 1.36 | -57.04 | 1.5502 | -2.5486 | |||
| ZTS / Zoetis Inc. | Call | 0.01 | -14.44 | 1.34 | -13.56 | 1.5256 | -0.4792 | ||
| TRTL / TortoiseEcofin Acquisition Corp. III | 0.12 | 32.32 | 1.30 | 33.71 | 1.4774 | 0.2219 | |||
| US31561T2015 / Feutune Light Acquisition Corp. | 0.10 | 0.00 | 1.09 | 0.93 | 1.2390 | -0.1554 | |||
| WNNR / Andretti Acquisition Corp. | 0.10 | 1.07 | 1.2242 | 1.2242 | |||||
| ALTU / Altitude Acquisition Corp. | 0.09 | 0.00 | 0.88 | 0.92 | 0.9971 | -0.1243 | |||
| AVRO / AVROBIO, Inc. | 0.56 | 0.86 | 0.9800 | 0.9800 | |||||
| TENK / TenX Keane Acquisition | 0.07 | 0.00 | 0.81 | 2.28 | 0.9198 | -0.1017 | |||
| SIMO / Silicon Motion Technology Corporation - Depositary Receipt (Common Stock) | 0.01 | 0.75 | 0.8526 | 0.8526 | |||||
| SIMO / Silicon Motion Technology Corporation - Depositary Receipt (Common Stock) | Put | 0.01 | 0.72 | 0.8171 | 0.8171 | ||||
| MCAC / Monterey Capital Acquisition Corporation | 0.06 | 0.00 | 0.64 | 1.75 | 0.7270 | -0.0852 | |||
| MO / Altria Group, Inc. | Call | 0.01 | 0.59 | 0.6704 | 0.6704 | ||||
| MO / Altria Group, Inc. | 0.01 | 0.00 | 0.59 | -7.26 | 0.6704 | -0.1499 | |||
| US62886HAX98 / CONV. NOTE | 0.58 | -15.70 | 0.6605 | -0.2298 | |||||
| ICPT / Intercept Pharmaceuticals Inc | Call | 0.03 | 0.56 | 0.6334 | 0.6334 | ||||
| ATMC / AlphaTime Acquisition Corp | 0.05 | 0.00 | 0.54 | 1.89 | 0.6129 | -0.0707 | |||
| / Aquaron Acquisition Corp. | 0.05 | 0.00 | 0.54 | 2.69 | 0.6098 | -0.0647 | |||
| US15719Y2046 / Cetus Capital Acquisition Corp. | 0.04 | 0.00 | 0.43 | 2.90 | 0.4856 | -0.0504 | |||
| MXL / MaxLinear, Inc. | 0.02 | 0.38 | 0.4287 | 0.4287 | |||||
| US73245B2060 / Pono Capital Two, Inc. | 0.03 | 0.00 | 0.34 | 2.71 | 0.3892 | -0.0413 | |||
| US0791742077 / Bellevue Life Sciences Acquisition Corp. | 0.03 | 0.00 | 0.32 | 0.00 | 0.3678 | -0.0494 | |||
| HOVR / New Horizon Aircraft Ltd. | 0.03 | 0.00 | 0.32 | 1.27 | 0.3625 | -0.0438 | |||
| MXL / MaxLinear, Inc. | Put | 0.01 | 0.31 | 0.3547 | 0.3547 | ||||
| PFF / iShares Trust - iShares Preferred and Income Securities ETF | 0.01 | 0.00 | 0.30 | -2.59 | 0.3433 | -0.0567 | |||
| MSSA / Metal Sky Star Acquisition Corporation | 0.02 | 0.00 | 0.22 | 0.92 | 0.2496 | -0.0318 | |||
| MARX / Mars Acquisition Corp. | 0.02 | 0.00 | 0.22 | -1.38 | 0.2454 | -0.0372 | |||
| GAMC / Golden Arrow Merger Corp. | 0.02 | 0.00 | 0.21 | 0.49 | 0.2355 | -0.0302 | |||
| OSI.U / Osiris Acquisition Corp. Units, each consisting of one share of Class A common stock, and one-half o | 0.02 | 0.00 | 0.21 | -1.90 | 0.2355 | -0.0361 | |||
| US35088F2065 / Four Leaf Acquisition Corp. | 0.02 | 0.00 | 0.18 | 1.10 | 0.2098 | -0.0258 | |||
| SGEN / Seagen Inc | Call | 0.00 | 0.15 | 0.1691 | 0.1691 | ||||
| VATE / INNOVATE Corp. | 0.08 | 0.00 | 0.13 | -7.59 | 0.1530 | -0.0347 | |||
| ICPT / Intercept Pharmaceuticals Inc | Put | 0.01 | 0.11 | 0.1246 | 0.1246 | ||||
| DNMR / Danimer Scientific, Inc. | 0.02 | 0.00 | 0.05 | -12.96 | 0.0542 | -0.0166 | |||
| TENX KEANE ACQUISITION / RIGHT 06/30/2028 (G8708L112) | 0.07 | 0.02 | 0.0000 | ||||||
| VGG0543H1174 / A SPAC II Acquisition Corp. | 0.00 | -100.00 | 0.00 | 0.0000 | -0.0005 | ||||
| EMBRACE CHANGE ACQUISITN COR / UNIT 03/17/2027 (G3034H133) | 0.00 | -100.00 | 0.00 | 0.0000 | |||||
| SPB / Spectrum Brands Holdings, Inc. | Call | 0.00 | -100.00 | 0.00 | -100.00 | -0.6057 | |||
| / Aquaron Acquisition Corp. | 0.00 | -100.00 | 0.00 | -100.00 | -0.0125 | ||||
| CORS / Corsair Partnering Corp - Class A | 0.00 | -100.00 | 0.00 | -100.00 | -0.2681 | ||||
| MO / Altria Group, Inc. | Put | 0.00 | -100.00 | 0.00 | -100.00 | -0.8203 | |||
| HRZN / Horizon Technology Finance Corporation | 0.00 | -100.00 | 0.00 | -100.00 | -0.1563 | ||||
| VGG0542S1305 / A SPAC I Acquisition Corp. | 0.00 | -100.00 | 0.00 | 0.0000 | -0.0012 | ||||
| PRDS / Pardes Biosciences Inc | 0.00 | -100.00 | 0.00 | 0.0000 | |||||
| VGG0542S1149 / A SPAC I Acquisition Corp. | 0.00 | -100.00 | 0.00 | -100.00 | -0.0060 | ||||
| PLTN / Plutonian Acquisition Corp. | 0.00 | -100.00 | 0.00 | -100.00 | -0.6216 | ||||
| EOCW / Elliott Opportunity II Corp - Class A | 0.00 | -100.00 | 0.00 | -100.00 | -2.4162 | ||||
| / FTAC Emerald Acquisition Corp. | 0.00 | -100.00 | 0.00 | 0.0000 | -0.0008 | ||||
| FHN / First Horizon Corporation | Call | 0.00 | -100.00 | 0.00 | -100.00 | -0.2770 | |||
| CNDA / Concord Acquisition Corp II | 0.00 | -100.00 | 0.00 | -100.00 | -2.7972 | ||||
| BSAQ / Black Spade Acquisition Co - Class A | 0.00 | -100.00 | 0.00 | -100.00 | -1.1334 | ||||
| EMLD / FTAC Emerald Acquisition Corp. | 0.00 | -100.00 | 0.00 | -100.00 | -0.2677 | ||||
| MCAFR / Mountain Crest Acquisition Corp IV - Tradeable Rights - June 2026 | 0.00 | -100.00 | 0.00 | -100.00 | -0.0115 | ||||
| AJRD / Aerojet Rocketdyne Holdings Inc | Put | 0.00 | -100.00 | 0.00 | -100.00 | -0.8162 | |||
| HUDA / Hudson Acquisition I Corp. | 0.00 | -100.00 | 0.00 | -100.00 | -1.2287 | ||||
| KYG063621265 / Aura FAT Projects Acquisition Corp. | 0.00 | -100.00 | 0.00 | 0.0000 | -0.0011 | ||||
| DNMR / Danimer Scientific, Inc. | Call | 0.00 | -100.00 | 0.00 | -100.00 | -0.0616 | |||
| VZ / Verizon Communications Inc. | 0.00 | -100.00 | 0.00 | -100.00 | -2.8862 | ||||
| VZ / Verizon Communications Inc. | Put | 0.00 | -100.00 | 0.00 | -100.00 | -1.9242 | |||
| US74738V1136 / Qomolangma Acquisition Corp. | 0.00 | -100.00 | 0.00 | 0.0000 | -0.0007 | ||||
| US61240F1167 / Monterey Bio Acquisition Corp. | 0.00 | -100.00 | 0.00 | 0.0000 | -0.0008 | ||||
| ATVI / Activision Blizzard Inc | Call | 0.00 | -100.00 | 0.00 | -100.00 | -1.1776 | |||
| ATVI / Activision Blizzard Inc | 0.00 | -100.00 | 0.00 | -100.00 | -3.2712 | ||||
| ASCB / A SPAC II Acquisition Corp. | 0.00 | -100.00 | 0.00 | 0.0000 | |||||
| / A SPAC II Acquisition Corp. | 0.00 | -100.00 | 0.00 | -100.00 | -0.0061 | ||||
| US60742N2053 / Mobiv Acquisition Corp. | 0.00 | -100.00 | 0.00 | -100.00 | -0.3351 | ||||
| CLBR / Colombier Acquisition Corp. II | 0.00 | -100.00 | 0.00 | -100.00 | -0.2657 | ||||
| KNSW / KnightSwan Acquisition Corp - Class A | 0.00 | -100.00 | 0.00 | -100.00 | -0.2734 | ||||
| / Global Star Acquisition, Inc., Class A | 0.00 | -100.00 | 0.00 | -100.00 | -1.7692 | ||||
| HMAC / Hainan Manaslu Acquisition Corp | 0.00 | -100.00 | 0.00 | -100.00 | -0.4107 |