Basic Stats
| Portfolio Value | $ 161,156,000 |
| Current Positions | 48 |
Latest Holdings, Performance, AUM (from 13F, 13D)
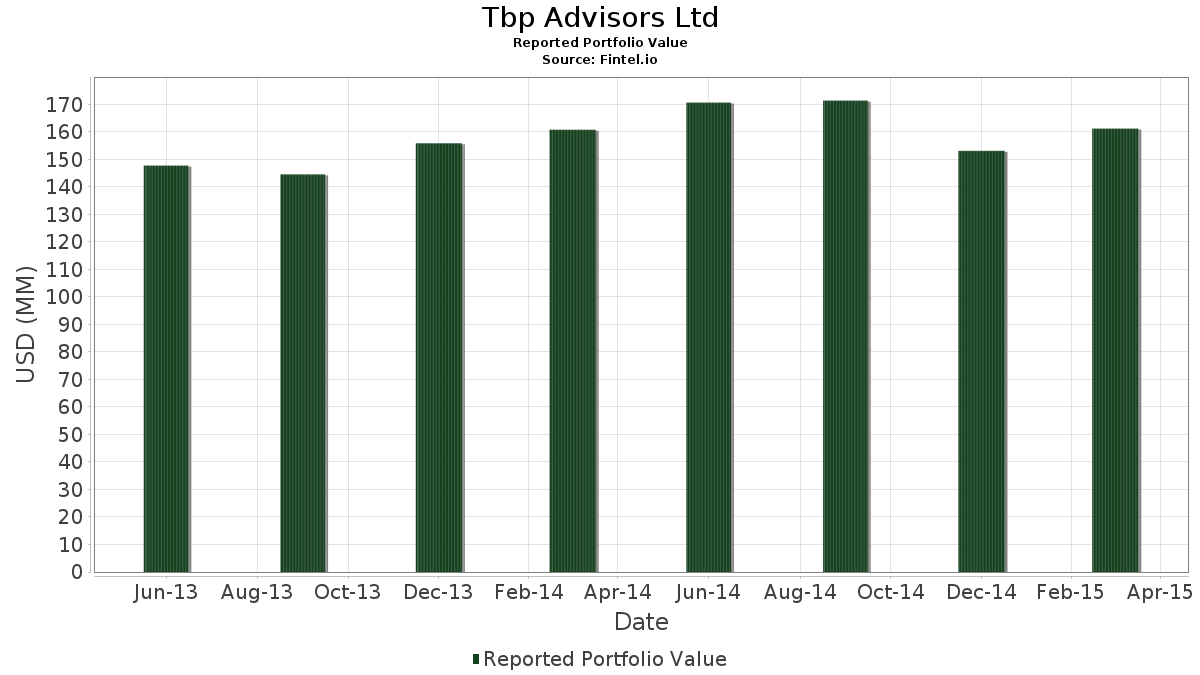
Tbp Advisors Ltd has disclosed 48 total holdings in their latest SEC filings. Most recent portfolio value is calculated to be $ 161,156,000 USD. Actual Assets Under Management (AUM) is this value plus cash (which is not disclosed). Tbp Advisors Ltd’s top holdings are Apple Inc. (US:AAPL) , Harman International Industries, Inc. (US:HAR) , Gilead Sciences, Inc. (US:GILD) , THOR Industries, Inc. (US:THO) , and Thermo Fisher Scientific Inc. (US:TMO) . Tbp Advisors Ltd’s new positions include iShares, Inc. - iShares MSCI Germany ETF (US:EWG) , The Coca-Cola Company (US:KO) , .
Top Increases This Quarter
We use the change in the portfolio allocation because this is the most meaningful metric. Changes can be due to trades or changes in share prices.
| Security | Shares (MM) |
Value (MM$) |
Portfolio % | ΔPortfolio % |
|---|---|---|---|---|
| 0.09 | 6.76 | 4.1959 | 4.1959 | |
| 0.16 | 4.73 | 2.9363 | 2.9363 | |
| 0.15 | 3.34 | 2.0750 | 2.0750 | |
| 0.16 | 3.38 | 2.0992 | 1.6687 | |
| 0.08 | 10.73 | 6.6575 | 0.8724 | |
| 0.02 | 0.78 | 0.4834 | 0.4834 | |
| 0.11 | 7.22 | 4.4795 | 0.2994 | |
| 0.23 | 6.58 | 4.0855 | 0.2594 | |
| 0.00 | 0.26 | 0.1589 | 0.1589 | |
| 0.01 | 0.21 | 0.1322 | 0.1322 |
Top Decreases This Quarter
We use the change in the portfolio allocation because this is the most meaningful metric. Changes can be due to trades or changes in share prices.
| Security | Shares (MM) |
Value (MM$) |
Portfolio % | ΔPortfolio % |
|---|---|---|---|---|
| 0.07 | 1.92 | 1.1939 | -0.9932 | |
| 0.16 | 6.84 | 4.2419 | -0.8574 | |
| 0.05 | 4.49 | 2.7830 | -0.8529 | |
| 0.14 | 4.30 | 2.6657 | -0.6227 | |
| 0.17 | 4.25 | 2.6353 | -0.5897 | |
| 0.11 | 6.94 | 4.3051 | -0.3649 | |
| 0.03 | 6.45 | 4.0005 | -0.2750 | |
| 0.02 | 3.44 | 2.1321 | -0.2607 | |
| 0.07 | 5.65 | 3.5047 | -0.2463 | |
| 0.02 | 2.21 | 1.3738 | -0.1985 |
13F and Fund Filings
This form was filed on 2015-04-17 for the reporting period 2015-03-31. Click the link icon to see the full transaction history.
Upgrade to unlock premium data and export to Excel ![]() .
.
| Security | Type | Avg Share Price | Shares (MM) |
ΔShares (%) |
ΔShares (%) |
Value ($MM) |
Portfolio (%) |
ΔPortfolio (%) |
|
|---|---|---|---|---|---|---|---|---|---|
| AAPL / Apple Inc. | 0.09 | -5.15 | 10.94 | 6.92 | 6.7872 | 0.1045 | |||
| HAR / Harman International Industries, Inc. | 0.08 | -3.26 | 10.73 | 21.15 | 6.6575 | 0.8724 | |||
| GILD / Gilead Sciences, Inc. | 0.08 | -0.47 | 7.68 | 3.62 | 4.7649 | -0.0762 | |||
| THO / THOR Industries, Inc. | 0.11 | -0.29 | 7.22 | 12.81 | 4.4795 | 0.2994 | |||
| TMO / Thermo Fisher Scientific Inc. | 0.05 | -0.37 | 7.16 | 6.82 | 4.4410 | 0.0643 | |||
| JPM / JPMorgan Chase & Co. | 0.11 | 0.25 | 6.94 | -2.95 | 4.3051 | -0.3649 | |||
| ORCL / Oracle Corporation | 0.16 | -8.74 | 6.84 | -12.43 | 4.2419 | -0.8574 | |||
| SAVE / Spirit Airlines, Inc. | 0.09 | 0.25 | 6.76 | 2.63 | 4.1959 | 4.1959 | |||
| DHI / D.R. Horton, Inc. | 0.23 | -0.17 | 6.58 | 12.41 | 4.0855 | 0.2594 | |||
| GS / The Goldman Sachs Group, Inc. | 0.03 | 1.57 | 6.45 | -1.50 | 4.0005 | -0.2750 | |||
| US0325111070 / Anadarko Petroleum Corp. | 0.07 | 0.24 | 5.89 | 0.61 | 3.6579 | -0.1694 | |||
| SLB / Schlumberger Limited | 0.07 | 0.68 | 5.65 | -1.64 | 3.5047 | -0.2463 | |||
| NKE / NIKE, Inc. | 0.05 | -1.11 | 5.39 | 3.20 | 3.3427 | -0.0672 | |||
| EWG / iShares, Inc. - iShares MSCI Germany ETF | 0.16 | 4.73 | 2.9363 | 2.9363 | |||||
| US92220P1057 / Varian Medical Systems, Inc. | 0.05 | -25.91 | 4.49 | -19.42 | 2.7830 | -0.8529 | |||
| GMF / SPDR Index Shares Funds - SPDR S&P Emerging Asia Pacific ETF | 0.05 | 0.42 | 4.38 | 5.97 | 2.7210 | 0.0178 | |||
| FLR / Fluor Corporation | 0.08 | 3.97 | 4.31 | -1.98 | 2.6738 | -0.1979 | |||
| INTC / Intel Corporation | 0.14 | -0.95 | 4.30 | -14.66 | 2.6657 | -0.6227 | |||
| EMC / Global X Funds - Global X Emerging Markets Great Consumer ETF | 0.17 | 0.08 | 4.25 | -13.98 | 2.6353 | -0.5897 | |||
| PII / Polaris Inc. | 0.02 | 0.56 | 3.44 | -6.20 | 2.1321 | -0.2607 | |||
| EOG / EOG Resources, Inc. | 0.04 | 0.49 | 3.41 | 0.09 | 2.1172 | -0.1097 | |||
| MLCO / Melco Resorts & Entertainment Limited - Depositary Receipt (Common Stock) | 0.16 | 507.42 | 3.38 | 413.35 | 2.0992 | 1.6687 | |||
| PIN / Invesco India Exchange-Traded Fund Trust - Invesco India ETF | 0.15 | -0.20 | 3.34 | 7.32 | 2.0750 | 2.0750 | |||
| ACN / Accenture plc | 0.03 | -0.86 | 3.24 | 4.01 | 2.0105 | -0.0244 | |||
| TPR / Tapestry, Inc. | 0.06 | 1.91 | 2.60 | 12.41 | 1.6133 | 0.1024 | |||
| HAL / Halliburton Company | 0.05 | -1.26 | 2.41 | 10.19 | 1.4961 | 0.0668 | |||
| 74005P104 / Praxair, Inc. | 0.02 | -1.29 | 2.21 | -8.02 | 1.3738 | -0.1985 | |||
| ROP / Roper Technologies, Inc. | 0.01 | -15.01 | 2.08 | -6.50 | 1.2938 | -0.1630 | |||
| QCOM / QUALCOMM Incorporated | 0.03 | 25.65 | 2.02 | 17.21 | 1.2553 | 0.1278 | |||
| CSCO / Cisco Systems, Inc. | 0.07 | -41.91 | 1.92 | -42.53 | 1.1939 | -0.9932 | |||
| LLTC / Linear Technology Corp. | 0.03 | 1.10 | 1.59 | 3.73 | 0.9848 | -0.0147 | |||
| IFN / The India Fund, Inc. | 0.04 | -4.53 | 1.16 | 4.59 | 0.7204 | -0.0047 | |||
| XOM / Exxon Mobil Corporation | 0.01 | 34.88 | 0.99 | 24.03 | 0.6118 | 0.0925 | |||
| REGN / Regeneron Pharmaceuticals, Inc. | 0.00 | 0.00 | 0.85 | 10.14 | 0.5256 | 0.0232 | |||
| DOW / Dow Inc. | 0.02 | 0.00 | 0.78 | 5.27 | 0.4834 | 0.4834 | |||
| PAYX / Paychex, Inc. | 0.01 | 3.33 | 0.71 | 10.97 | 0.4393 | 0.0226 | |||
| PG / The Procter & Gamble Company | 0.01 | 0.00 | 0.53 | -9.95 | 0.3258 | -0.0551 | |||
| IBM / International Business Machines Corporation | 0.00 | -17.88 | 0.52 | -17.83 | 0.3202 | -0.0901 | |||
| MRK / Merck & Co., Inc. | 0.01 | -5.33 | 0.52 | -4.27 | 0.3202 | -0.0319 | |||
| DIS / The Walt Disney Company | 0.00 | -10.67 | 0.44 | -0.45 | 0.2724 | -0.0157 | |||
| PEP / PepsiCo, Inc. | 0.00 | 0.00 | 0.40 | 1.26 | 0.2494 | -0.0099 | |||
| T / AT&T Inc. | 0.01 | -9.01 | 0.34 | -11.49 | 0.2104 | -0.0398 | |||
| MO / Altria Group, Inc. | 0.01 | 0.00 | 0.31 | 1.64 | 0.1924 | -0.0069 | |||
| GE / General Electric Company | 0.01 | -7.24 | 0.29 | -8.92 | 0.1775 | -0.0277 | |||
| COF / Capital One Financial Corporation | 0.00 | 0.00 | 0.28 | -4.42 | 0.1744 | -0.0177 | |||
| EMR / Emerson Electric Co. | 0.00 | 0.00 | 0.26 | -8.45 | 0.1613 | -0.0242 | |||
| ED / Consolidated Edison, Inc. | 0.00 | 0.00 | 0.26 | -7.58 | 0.1589 | 0.1589 | |||
| KO / The Coca-Cola Company | 0.01 | 0.21 | 0.1322 | 0.1322 | |||||
| MSFT / Microsoft Corporation | 0.00 | -100.00 | 0.00 | -100.00 | -0.1535 | ||||
| UNP / Union Pacific Corporation | 0.00 | -100.00 | 0.00 | -100.00 | 0.0000 |