Basic Stats
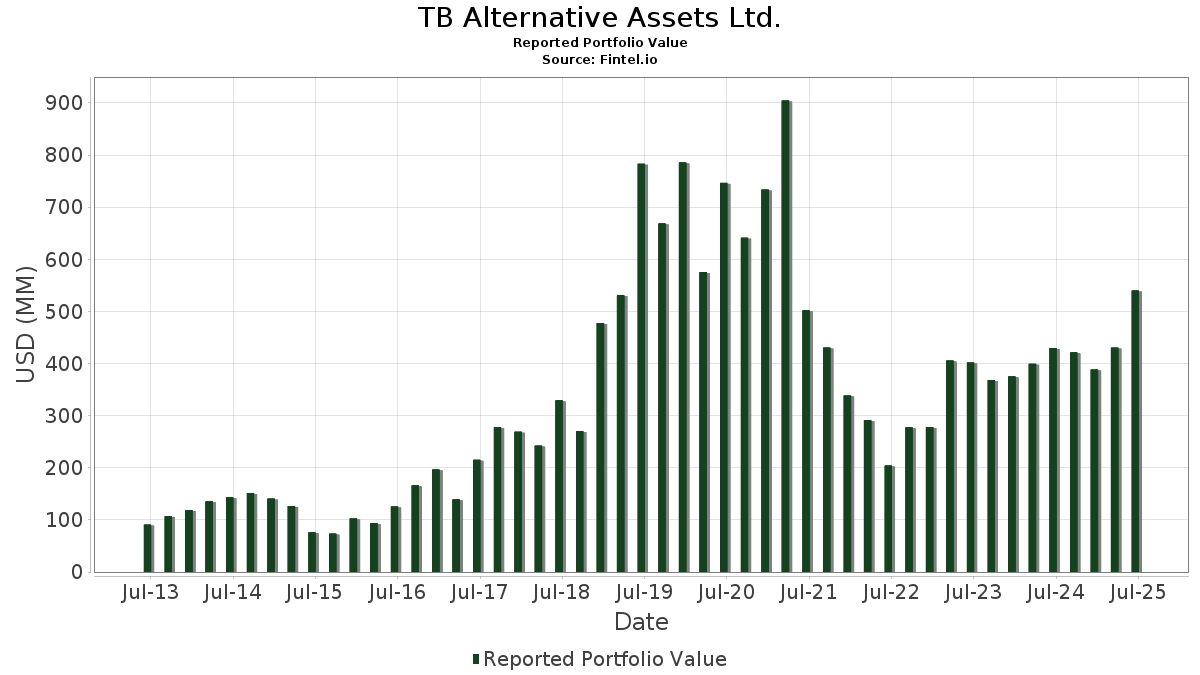
| Portfolio Value | $ 540,035,934 |
| Current Positions | 41 |
Latest Holdings, Performance, AUM (from 13F, 13D)
TB Alternative Assets Ltd. has disclosed 41 total holdings in their latest SEC filings. Most recent portfolio value is calculated to be $ 540,035,934 USD. Actual Assets Under Management (AUM) is this value plus cash (which is not disclosed). TB Alternative Assets Ltd.’s top holdings are Alphabet Inc. (US:GOOG) , Constellation Energy Corporation (US:CEG) , Zillow Group, Inc. (US:Z) , Intel Corporation (US:INTC) , and Coinbase Global, Inc. (US:COIN) . TB Alternative Assets Ltd.’s new positions include Sportradar Group AG (US:SRAD) , UnitedHealth Group Incorporated (US:UNH) , Cleveland-Cliffs Inc. (US:CLF) , GS Connect S&P GSCI Enhanced Commodity Total Return ETN (US:GSCE) , and Circle Internet Group, Inc. (US:CRCL) . TB Alternative Assets Ltd.’s top industries are "Restaurants, Dining, Eating And Drinking Places" (sic 58) , "Electronic And Other Electrical Equipment And Components, Except Computer Equipment" (sic 36) , and "General Merchandise Stores" (sic 53) .
Top Increases This Quarter
We use the change in the portfolio allocation because this is the most meaningful metric. Changes can be due to trades or changes in share prices.
| Security | Shares (MM) |
Value (MM$) |
Portfolio % | ΔPortfolio % |
|---|---|---|---|---|
| 2.01 | 44.93 | 8.3194 | 8.3194 | |
| 0.12 | 41.00 | 7.5925 | 7.5925 | |
| 0.34 | 40.63 | 7.5233 | 7.5233 | |
| 0.30 | 53.58 | 9.9211 | 2.8085 | |
| 1.26 | 34.79 | 6.4421 | 2.1454 | |
| 0.18 | 13.71 | 2.5393 | 1.5370 | |
| 0.28 | 7.88 | 1.4599 | 1.4599 | |
| 3.07 | 9.51 | 1.7611 | 1.1694 | |
| 0.02 | 5.26 | 0.9739 | 0.9739 | |
| 0.45 | 4.65 | 0.8607 | 0.8607 |
Top Decreases This Quarter
We use the change in the portfolio allocation because this is the most meaningful metric. Changes can be due to trades or changes in share prices.
| Security | Shares (MM) |
Value (MM$) |
Portfolio % | ΔPortfolio % |
|---|---|---|---|---|
| 0.01 | 1.79 | 0.3317 | -6.7780 | |
| 0.00 | 0.00 | -2.0714 | ||
| 0.00 | 0.00 | -2.0273 | ||
| 0.21 | 22.28 | 4.1258 | -1.3701 | |
| 0.00 | 0.00 | -1.1594 | ||
| 0.04 | 29.05 | 5.3785 | -1.0885 | |
| 0.08 | 3.17 | 0.5878 | -0.7918 | |
| 0.05 | 39.93 | 7.3945 | -0.7149 | |
| 0.23 | 19.91 | 3.6863 | -0.7074 | |
| 0.04 | 4.92 | 0.9105 | -0.7001 |
13D/G Filings
This is a list of 13D and 13G filings made in the last year (if any). Click the link icon to see the full transaction history. Green rows indicate new positions. Red rows indicate closed positions.
| File Date | Form | Security | Prev Shares |
Current Shares |
ΔShares % | % Ownership |
% ΔOwnership | |
|---|---|---|---|---|---|---|---|---|
| 2025-02-10 | RAASY / Cloopen Group Holding Limited - Depositary Receipt (Common Stock) | 38,474,611 | 38,474,611 | 0.00 | 11.52 | -1.54 | ||
| 2025-02-10 | SY / So-Young International Inc. - Depositary Receipt (Common Stock) | 8,237,774 | 8,237,774 | 0.00 | 10.54 | -3.13 | ||
| 2025-02-10 | MOGU / MOGU Inc. - Depositary Receipt (Common Stock) | 206,730,009 | 206,730,009 | 0.00 | 8.39 | 0.00 | ||
| 2025-02-07 | MKDTY / Molecular Data Inc. - Depositary Receipt (Common Stock) | 20,044,756 | 20,044,756 | 0.00 | 5.23 | 0.00 | ||
| 2025-02-07 | YJ / Yunji Inc. - Depositary Receipt (Common Stock) | 107,250,000 | 107,250,000 | 0.00 | 5.45 | 9.66 |
13F and Fund Filings
This form was filed on 2025-07-16 for the reporting period 2025-06-30. Click the link icon to see the full transaction history.
Upgrade to unlock premium data and export to Excel ![]() .
.