Basic Stats
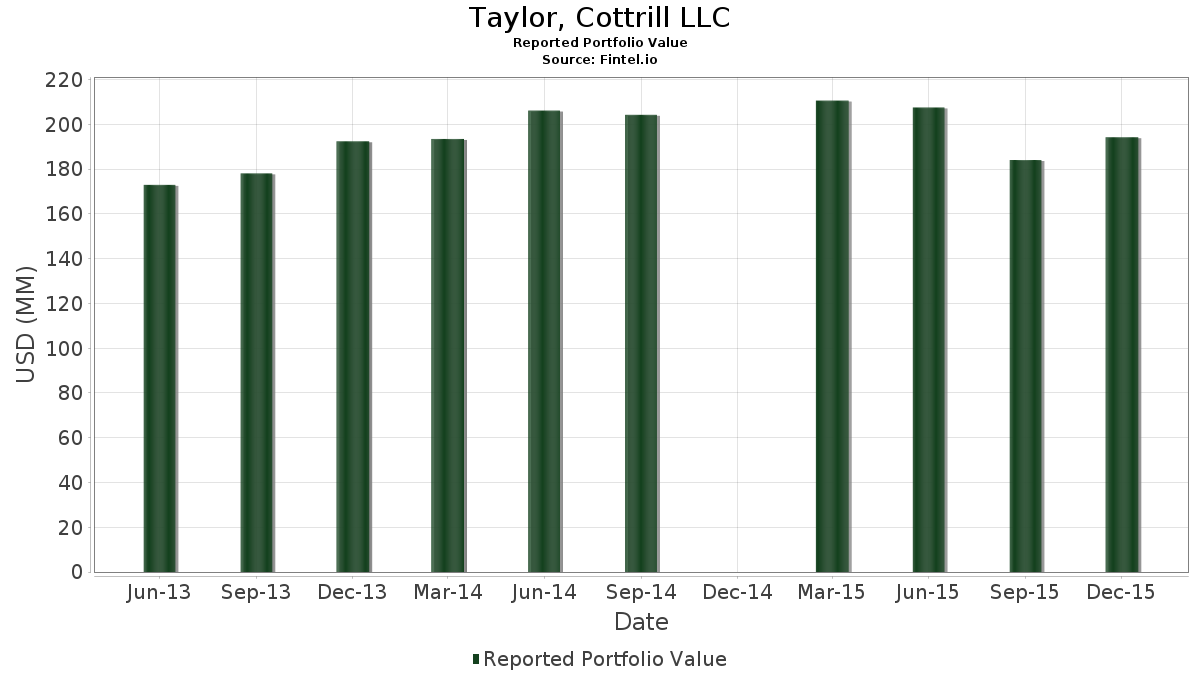
| Portfolio Value | $ 194,293,000 |
| Current Positions | 109 |
Latest Holdings, Performance, AUM (from 13F, 13D)
Taylor, Cottrill LLC has disclosed 109 total holdings in their latest SEC filings. Most recent portfolio value is calculated to be $ 194,293,000 USD. Actual Assets Under Management (AUM) is this value plus cash (which is not disclosed). Taylor, Cottrill LLC’s top holdings are The Walt Disney Company (US:DIS) , General Electric Company (US:GE) , Apple Inc. (US:AAPL) , Amgen Inc. (US:AMGN) , and Thermo Fisher Scientific Inc. (US:TMO) . Taylor, Cottrill LLC’s new positions include Chubb Limited (US:CB) , Cummins Inc. (US:CMI) , McKesson Corporation (US:MCK) , Schwab Strategic Trust - Schwab International Equity ETF (US:SCHF) , and Schwab Strategic Trust - Schwab U.S. Dividend Equity ETF (US:SCHD) .
Top Increases This Quarter
We use the change in the portfolio allocation because this is the most meaningful metric. Changes can be due to trades or changes in share prices.
| Security | Shares (MM) |
Value (MM$) |
Portfolio % | ΔPortfolio % |
|---|---|---|---|---|
| 0.02 | 1.95 | 1.0042 | 1.0042 | |
| 0.02 | 2.26 | 1.1647 | 0.8964 | |
| 0.02 | 1.70 | 0.8755 | 0.8755 | |
| 0.01 | 1.50 | 0.7720 | 0.7720 | |
| 0.21 | 6.65 | 3.4237 | 0.5054 | |
| 0.04 | 5.96 | 3.0665 | 0.2900 | |
| 0.04 | 4.69 | 2.4129 | 0.2620 | |
| 0.04 | 5.80 | 2.9842 | 0.2429 | |
| 0.07 | 3.60 | 1.8549 | 0.2385 | |
| 0.02 | 5.16 | 2.6553 | 0.2144 |
Top Decreases This Quarter
We use the change in the portfolio allocation because this is the most meaningful metric. Changes can be due to trades or changes in share prices.
| Security | Shares (MM) |
Value (MM$) |
Portfolio % | ΔPortfolio % |
|---|---|---|---|---|
| 0.00 | 0.00 | -1.3215 | ||
| 0.08 | 1.22 | 0.6300 | -0.9424 | |
| 0.00 | 0.00 | -0.5285 | ||
| 0.01 | 0.38 | 0.1971 | -0.4899 | |
| 0.06 | 6.36 | 3.2734 | -0.3314 | |
| 0.08 | 7.93 | 4.0794 | -0.2619 | |
| 0.01 | 3.07 | 1.5785 | -0.2486 | |
| 0.04 | 3.74 | 1.9234 | -0.2275 | |
| 0.05 | 4.26 | 2.1946 | -0.1833 | |
| 0.03 | 3.98 | 2.0485 | -0.1285 |
13F and Fund Filings
This form was filed on 2016-02-05 for the reporting period 2015-12-31. Click the link icon to see the full transaction history.
Upgrade to unlock premium data and export to Excel ![]() .
.
| Security | Type | Avg Share Price | Shares (MM) |
ΔShares (%) |
ΔShares (%) |
Value ($MM) |
Portfolio (%) |
ΔPortfolio (%) |
|
|---|---|---|---|---|---|---|---|---|---|
| DIS / The Walt Disney Company | 0.08 | -3.55 | 7.93 | -0.84 | 4.0794 | -0.2619 | |||
| GE / General Electric Company | 0.21 | 0.22 | 6.65 | 23.80 | 3.4237 | 0.5054 | |||
| AAPL / Apple Inc. | 0.06 | 0.42 | 6.36 | -4.17 | 3.2734 | -0.3314 | |||
| AMGN / Amgen Inc. | 0.04 | -0.68 | 5.96 | 16.55 | 3.0665 | 0.2900 | |||
| TMO / Thermo Fisher Scientific Inc. | 0.04 | -0.97 | 5.80 | 14.88 | 2.9842 | 0.2429 | |||
| ITW / Illinois Tool Works Inc. | 0.06 | 0.50 | 5.42 | 13.15 | 2.7901 | 0.1879 | |||
| C.WSA / Citigroup, Inc. | 0.02 | 0.26 | 5.16 | 14.80 | 2.6553 | 0.2144 | |||
| XOM / Exxon Mobil Corporation | 0.06 | 0.51 | 4.79 | 5.37 | 2.4643 | -0.0037 | |||
| BUD / Anheuser-Busch InBev SA/NV - Depositary Receipt (Common Stock) | 0.04 | 0.67 | 4.69 | 18.38 | 2.4129 | 0.2620 | |||
| ACN / Accenture plc | 0.04 | -0.84 | 4.60 | 5.45 | 2.3681 | -0.0017 | |||
| ORCL / Oracle Corporation | 0.12 | -0.52 | 4.54 | 0.62 | 2.3362 | -0.1140 | |||
| MCD / McDonald's Corporation | 0.04 | -5.36 | 4.27 | 13.46 | 2.1993 | 0.1538 | |||
| CHD / Church & Dwight Co., Inc. | 0.05 | -3.74 | 4.26 | -2.60 | 2.1946 | -0.1833 | |||
| JNJ / Johnson & Johnson | 0.04 | -1.28 | 4.11 | 8.62 | 2.1154 | 0.0601 | |||
| MMM / 3M Company | 0.03 | -0.19 | 4.01 | 6.05 | 2.0665 | 0.0101 | |||
| BRK.B / Berkshire Hathaway Inc. | 0.03 | -1.95 | 3.98 | -0.70 | 2.0485 | -0.1285 | |||
| SYK / Stryker Corporation | 0.04 | 1.42 | 3.81 | 0.18 | 1.9589 | -0.1045 | |||
| NVS / Novartis AG - Depositary Receipt (Common Stock) | 0.04 | 0.81 | 3.74 | -5.63 | 1.9234 | -0.2275 | |||
| PKG / Packaging Corporation of America | 0.06 | 4.67 | 3.67 | 9.67 | 1.8915 | 0.0714 | |||
| MRK / Merck & Co., Inc. | 0.07 | 13.24 | 3.60 | 21.10 | 1.8549 | 0.2385 | |||
| MA / Mastercard Incorporated | 0.04 | -2.26 | 3.49 | 5.56 | 1.7968 | 0.0006 | |||
| PG / The Procter & Gamble Company | 0.04 | 1.19 | 3.41 | 11.68 | 1.7571 | 0.0968 | |||
| PCP / Precision Castparts Corporation | 0.01 | -9.73 | 3.07 | -8.83 | 1.5785 | -0.2486 | |||
| MSFT / Microsoft Corporation | 0.05 | -20.67 | 3.03 | -0.56 | 1.5610 | -0.0955 | |||
| VCSH / Vanguard Scottsdale Funds - Vanguard Short-Term Corporate Bond ETF | 0.04 | 4.06 | 2.87 | 3.13 | 1.4761 | -0.0344 | |||
| INTC / Intel Corporation | 0.08 | 0.00 | 2.86 | 14.30 | 1.4730 | 0.1130 | |||
| WFC / Wells Fargo & Company | 0.05 | 0.84 | 2.60 | 6.74 | 1.3377 | 0.0151 | |||
| 74005P104 / Praxair, Inc. | 0.02 | -0.61 | 2.52 | -0.08 | 1.2965 | -0.0728 | |||
| ABBV / AbbVie Inc. | 0.04 | 7.65 | 2.48 | 17.22 | 1.2790 | 0.1275 | |||
| AMLP / ALPS ETF Trust - Alerian MLP ETF | 0.20 | 1.68 | 2.42 | -1.83 | 1.2445 | -0.0932 | |||
| ADP / Automatic Data Processing, Inc. | 0.03 | -1.07 | 2.35 | 4.30 | 1.2100 | -0.0142 | |||
| SBUX / Starbucks Corporation | 0.04 | -4.25 | 2.32 | 1.13 | 1.1951 | -0.0520 | |||
| CNI / Canadian National Railway Company | 0.04 | 0.12 | 2.28 | -1.43 | 1.1740 | -0.0828 | |||
| RTX / RTX Corporation | 0.02 | 324.12 | 2.26 | 358.10 | 1.1647 | 0.8964 | |||
| NSRGY / Nestlé S.A. - Depositary Receipt (Common Stock) | 0.03 | 1.73 | 2.19 | 0.64 | 1.1287 | -0.0548 | |||
| SCHH / Schwab Strategic Trust - Schwab U.S. REIT ETF | 0.05 | 1.29 | 2.14 | 7.96 | 1.1030 | 0.0248 | |||
| IBM / International Business Machines Corporation | 0.02 | 0.99 | 2.10 | -4.11 | 1.0798 | -0.1086 | |||
| CB / Chubb Limited | 0.02 | 1.95 | 1.0042 | 1.0042 | |||||
| CVX / Chevron Corporation | 0.02 | -11.19 | 1.90 | 1.33 | 0.9800 | -0.0406 | |||
| CSCO / Cisco Systems, Inc. | 0.07 | -0.30 | 1.79 | 3.11 | 0.9228 | -0.0217 | |||
| CMI / Cummins Inc. | 0.02 | 1.70 | 0.8755 | 0.8755 | |||||
| KO / The Coca-Cola Company | 0.04 | 0.16 | 1.70 | 7.25 | 0.8755 | 0.0141 | |||
| JPM / JPMorgan Chase & Co. | 0.03 | 7.82 | 1.66 | 16.71 | 0.8554 | 0.0820 | |||
| ABT / Abbott Laboratories | 0.04 | 0.00 | 1.62 | 11.64 | 0.8343 | 0.0457 | |||
| MCK / McKesson Corporation | 0.01 | 1.50 | 0.7720 | 0.7720 | |||||
| ESRX / Express Scripts Holding Co. | 0.02 | 5.17 | 1.42 | 13.57 | 0.7324 | 0.0518 | |||
| CL / Colgate-Palmolive Company | 0.02 | 0.00 | 1.37 | 4.98 | 0.7051 | -0.0037 | |||
| DORM / Dorman Products, Inc. | 0.03 | 0.55 | 1.29 | -6.17 | 0.6650 | -0.0829 | |||
| OXY / Occidental Petroleum Corporation | 0.02 | -1.87 | 1.24 | 0.32 | 0.6382 | -0.0331 | |||
| KMI / Kinder Morgan, Inc. | 0.08 | -21.54 | 1.22 | -57.72 | 0.6300 | -0.9424 | |||
| MDT / Medtronic plc | 0.02 | -9.94 | 1.22 | 3.48 | 0.6274 | -0.0124 | |||
| RHHBY / Roche Holding AG - Depositary Receipt (Common Stock) | 0.03 | 9.08 | 1.18 | 14.12 | 0.6073 | 0.0457 | |||
| CLX / The Clorox Company | 0.01 | -0.81 | 1.16 | 8.94 | 0.5960 | 0.0186 | |||
| PFE / Pfizer Inc. | 0.03 | 7.31 | 1.10 | 10.21 | 0.5667 | 0.0241 | |||
| EMC / Global X Funds - Global X Emerging Markets Great Consumer ETF | 0.04 | -9.52 | 1.08 | -3.82 | 0.5579 | -0.0542 | |||
| T / AT&T Inc. | 0.03 | 1.83 | 1.02 | 7.58 | 0.5260 | 0.0100 | |||
| PEG / Public Service Enterprise Group Incorporated | 0.03 | 25.45 | 1.00 | 15.06 | 0.5152 | 0.0427 | |||
| BSJG / Guggenheim BulletShares 2016 High Yield Corporate Bond ETF | 0.04 | -0.23 | 0.96 | -0.21 | 0.0000 | ||||
| DVN / Devon Energy Corporation | 0.03 | 13.87 | 0.91 | -1.72 | 0.4699 | -0.0347 | |||
| TEL / TE Connectivity plc | 0.01 | -12.49 | 0.91 | -5.53 | 0.4663 | -0.0546 | |||
| HD / The Home Depot, Inc. | 0.01 | 1.49 | 0.90 | 16.22 | 0.4648 | 0.0427 | |||
| GD / General Dynamics Corporation | 0.01 | 0.00 | 0.87 | -0.46 | 0.4488 | -0.0270 | |||
| ROST / Ross Stores, Inc. | 0.02 | 0.00 | 0.86 | 10.97 | 0.4426 | 0.0217 | |||
| RDS.A / Shell Plc - ADR (Representing Ordinary Shares - Class A) | 0.02 | -15.39 | 0.84 | -18.23 | 0.4339 | -0.1261 | |||
| VFC / V.F. Corporation | 0.01 | 9.06 | 0.82 | -0.48 | 0.4241 | -0.0256 | |||
| NEE / NextEra Energy, Inc. | 0.01 | -1.35 | 0.76 | 5.11 | 0.3917 | -0.0016 | |||
| PM / Philip Morris International Inc. | 0.01 | 0.00 | 0.74 | 10.90 | 0.3824 | 0.0185 | |||
| DUK / Duke Energy Corporation | 0.01 | 0.00 | 0.71 | -0.70 | 0.3644 | -0.0229 | |||
| VNQI / Vanguard International Equity Index Funds - Vanguard Global ex-U.S. Real Estate ETF | 0.01 | 13.01 | 0.67 | 13.27 | 0.3428 | 0.0234 | |||
| BMY / Bristol-Myers Squibb Company | 0.01 | 0.00 | 0.66 | 16.14 | 0.3407 | 0.0311 | |||
| AXP / American Express Company | 0.01 | -1.58 | 0.65 | -7.65 | 0.3356 | -0.0479 | |||
| PEAK / Healthpeak Properties, Inc. | 0.02 | -8.46 | 0.61 | -6.01 | 0.3140 | -0.0385 | |||
| DISCA / Discovery Inc - Class A | 0.02 | -14.05 | 0.60 | -11.89 | 0.3088 | -0.0611 | |||
| SLB / Schlumberger Limited | 0.01 | -14.76 | 0.60 | -13.83 | 0.3078 | -0.0692 | |||
| GIS / General Mills, Inc. | 0.01 | 0.00 | 0.59 | 2.77 | 0.3052 | -0.0082 | |||
| GOOGL / Alphabet Inc. | 0.00 | 46.15 | 0.52 | 78.28 | 0.2661 | 0.1086 | |||
| TROW / T. Rowe Price Group, Inc. | 0.01 | -2.70 | 0.52 | 0.00 | 0.2656 | -0.0147 | |||
| MMP / Magellan Midstream Partners L.P. | 0.01 | 0.00 | 0.51 | 12.97 | 0.2645 | 0.0174 | |||
| CNQ / Canadian Natural Resources Limited | 0.02 | -7.64 | 0.50 | 3.76 | 0.2558 | -0.0044 | |||
| BK / The Bank of New York Mellon Corporation | 0.01 | -12.18 | 0.49 | -7.65 | 0.2548 | -0.0364 | |||
| BSV / Vanguard Bond Index Funds - Vanguard Short-Term Bond ETF | 0.01 | 0.00 | 0.48 | -1.04 | 0.2460 | -0.0163 | |||
| SHY / iShares Trust - iShares 1-3 Year Treasury Bond ETF | 0.00 | 0.00 | 0.41 | -0.72 | 0.2126 | -0.0134 | |||
| MINT / PIMCO ETF Trust - PIMCO Enhanced Short Maturity Active Exchange-Traded Fund | 0.00 | 0.00 | 0.39 | -0.25 | 0.2018 | -0.0117 | |||
| TRI / Thomson Reuters Corporation | 0.01 | -3.72 | 0.39 | -9.47 | 0.2018 | -0.0334 | |||
| GAM / General American Investors Company, Inc. | 0.01 | 0.00 | 0.39 | 3.22 | 0.1982 | -0.0044 | |||
| DE / Deere & Company | 0.01 | -70.61 | 0.38 | -69.72 | 0.1971 | -0.4899 | |||
| ABMD / Abiomed Inc. | 0.00 | 0.00 | 0.37 | -2.87 | 0.1915 | -0.0166 | |||
| SPY / SPDR S&P 500 ETF | 0.00 | 0.00 | 0.37 | 6.32 | 0.1904 | 0.0014 | |||
| CHRW / C.H. Robinson Worldwide, Inc. | 0.01 | 0.00 | 0.36 | -8.48 | 0.1832 | -0.0281 | |||
| BIV / Vanguard Bond Index Funds - Vanguard Intermediate-Term Bond ETF | 0.00 | 0.00 | 0.34 | -1.99 | 0.1776 | -0.0136 | |||
| DISCK / Warner Bros.Discovery Inc - Series C | 0.01 | -23.82 | 0.34 | -20.79 | 0.1745 | -0.0580 | |||
| GPC / Genuine Parts Company | 0.00 | 0.00 | 0.33 | 3.75 | 0.1709 | -0.0029 | |||
| SCHF / Schwab Strategic Trust - Schwab International Equity ETF | 0.01 | 0.31 | 0.1611 | 0.1611 | |||||
| PEP / PepsiCo, Inc. | 0.00 | 1.97 | 0.31 | 8.13 | 0.1575 | 0.0038 | |||
| KMB / Kimberly-Clark Corporation | 0.00 | 3.12 | 0.29 | 20.41 | 0.1518 | 0.0188 | |||
| UPS / United Parcel Service, Inc. | 0.00 | 8.99 | 0.29 | 6.18 | 0.1503 | 0.0009 | |||
| BSCG / Guggenheim BulletShares 2016 Corporate Bond ETF | 0.01 | 0.00 | 0.29 | -0.68 | 0.1493 | -0.0093 | |||
| CI / The Cigna Group | 0.00 | 0.00 | 0.26 | 8.23 | 0.1354 | 0.0034 | |||
| HON / Honeywell International Inc. | 0.00 | 0.00 | 0.25 | 9.65 | 0.1287 | 0.0048 | |||
| WPC / W. P. Carey Inc. | 0.00 | 0.00 | 0.24 | 2.10 | 0.1251 | -0.0042 | |||
| EMR / Emerson Electric Co. | 0.01 | 8.33 | 0.24 | 16.91 | 0.1246 | 0.0121 | |||
| / Total S.A. | 0.01 | -2.78 | 0.24 | -2.07 | 0.1215 | -0.0094 | |||
| SCHD / Schwab Strategic Trust - Schwab U.S. Dividend Equity ETF | 0.01 | 0.23 | 0.1184 | 0.1184 | |||||
| SYY / Sysco Corporation | 0.01 | 0.00 | 0.22 | 4.83 | 0.1117 | -0.0007 | |||
| MLPA / Global X Funds - Global X MLP ETF | 0.02 | 0.21 | 0.1096 | 0.1096 | |||||
| BPK / BlackRock Municipal 2018 Term Trust | 0.01 | 0.18 | 0.0942 | 0.0942 | |||||
| GTE / Gran Tierra Energy Inc. | 0.01 | 0.03 | 0.0129 | 0.0129 | |||||
| EKSO / Ekso Bionics Holdings, Inc. | 0.01 | 0.01 | 0.0051 | 0.0051 | |||||
| 1/100000 Ergo Sci Corp / (CKE81Q300) | 0.08 | 0.00 | 0.01 | 0.00 | 0.0000 | ||||
| SIAL / Sigma-Aldrich Corporation | 0.00 | -100.00 | 0.00 | -100.00 | -1.3215 | ||||
| BSJF / Guggenheim BulletShares 2015 High Yield Corporate Bond ETF | 0.00 | -100.00 | 0.00 | -100.00 | 0.0000 | ||||
| PGR / The Progressive Corporation | 0.00 | -100.00 | 0.00 | -100.00 | -0.5285 |