Basic Stats
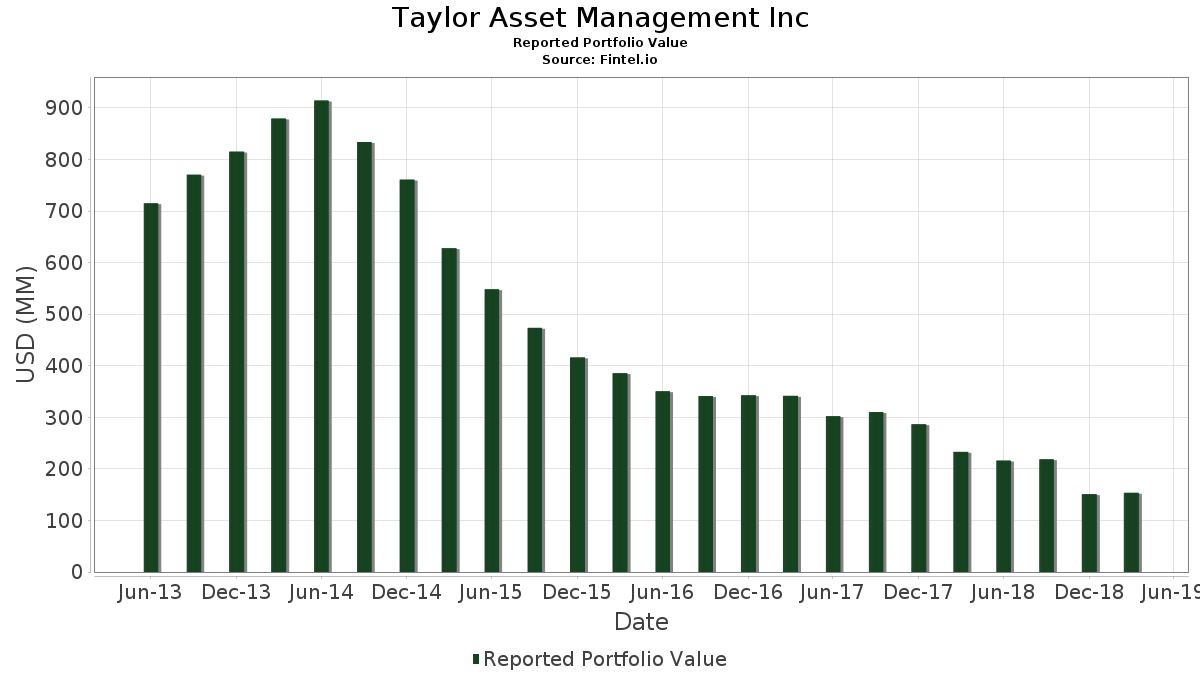
| Portfolio Value | $ 153,549,000 |
| Current Positions | 31 |
Latest Holdings, Performance, AUM (from 13F, 13D)
Taylor Asset Management Inc has disclosed 31 total holdings in their latest SEC filings. Most recent portfolio value is calculated to be $ 153,549,000 USD. Actual Assets Under Management (AUM) is this value plus cash (which is not disclosed). Taylor Asset Management Inc’s top holdings are Assured Guaranty Ltd. (US:AGO) , The Allstate Corporation (US:ALL) , Whirlpool Corporation (US:WHR) , Celgene Corp. (US:CELG) , and The Toronto-Dominion Bank (US:TD) . Taylor Asset Management Inc’s new positions include Weyerhaeuser Company (US:WY) , Bristol-Myers Squibb Company (US:BMY) , The Walt Disney Company (US:DIS) , Johnson & Johnson (US:JNJ) , and Brookfield Property REIT Inc. (US:BPR) .
Top Increases This Quarter
We use the change in the portfolio allocation because this is the most meaningful metric. Changes can be due to trades or changes in share prices.
| Security | Shares (MM) |
Value (MM$) |
Portfolio % | ΔPortfolio % |
|---|---|---|---|---|
| 0.53 | 14.06 | 9.1593 | 9.1593 | |
| 0.06 | 9.63 | 6.2749 | 3.5120 | |
| 0.30 | 16.22 | 10.5641 | 2.8533 | |
| 0.07 | 3.10 | 2.0222 | 2.0222 | |
| 0.20 | 18.44 | 12.0111 | 1.3586 | |
| 0.01 | 1.97 | 1.2849 | 1.2849 | |
| 0.03 | 1.19 | 0.7770 | 0.7770 | |
| 0.24 | 1.02 | 0.6630 | 0.6630 | |
| 0.22 | 20.85 | 13.5787 | 0.5086 | |
| 0.00 | 0.45 | 0.2898 | 0.2898 |
Top Decreases This Quarter
We use the change in the portfolio allocation because this is the most meaningful metric. Changes can be due to trades or changes in share prices.
| Security | Shares (MM) |
Value (MM$) |
Portfolio % | ΔPortfolio % |
|---|---|---|---|---|
| 0.00 | 0.00 | -9.5743 | ||
| 2.23 | 9.01 | 5.8646 | -4.5228 | |
| 0.02 | 2.50 | 1.6275 | -1.6450 | |
| 0.26 | 0.58 | 0.3777 | -1.1392 | |
| 0.68 | 6.46 | 4.2078 | -0.7699 | |
| 0.55 | 24.46 | 15.9330 | -0.7330 | |
| 0.54 | 0.47 | 0.3067 | -0.3586 | |
| 0.00 | 0.00 | -0.1836 | ||
| 0.00 | 0.00 | -0.1750 | ||
| 0.00 | 0.00 | -0.1630 |
13F and Fund Filings
This form was filed on 2019-05-14 for the reporting period 2019-03-31. Click the link icon to see the full transaction history.
Upgrade to unlock premium data and export to Excel ![]() .
.
| Security | Type | Avg Share Price | Shares (MM) |
ΔShares (%) |
ΔShares (%) |
Value ($MM) |
Portfolio (%) |
ΔPortfolio (%) |
|
|---|---|---|---|---|---|---|---|---|---|
| AGO / Assured Guaranty Ltd. | 0.55 | -16.18 | 24.46 | -2.72 | 15.9330 | -0.7330 | |||
| ALL / The Allstate Corporation | 0.22 | -7.25 | 20.85 | 5.72 | 13.5787 | 0.5086 | |||
| WHR / Whirlpool Corporation | 0.14 | -16.21 | 18.73 | 4.20 | 12.1955 | 0.2851 | |||
| CELG / Celgene Corp. | 0.20 | -22.05 | 18.44 | 14.74 | 12.0111 | 1.3586 | |||
| TD / The Toronto-Dominion Bank | 0.30 | 27.79 | 16.22 | 39.42 | 10.5641 | 2.8533 | |||
| WY / Weyerhaeuser Company | 0.53 | 14.06 | 9.1593 | 9.1593 | |||||
| META / Meta Platforms, Inc. | 0.06 | 81.76 | 9.63 | 131.11 | 6.2749 | 3.5120 | |||
| MAXR / Maxar Technologies Inc | 2.23 | 69.99 | 9.01 | -42.55 | 5.8646 | -4.5228 | |||
| MBI / MBIA Inc. | 0.68 | -19.40 | 6.46 | -13.98 | 4.2078 | -0.7699 | |||
| OC / Owens Corning | 0.07 | 4.77 | 3.10 | 12.26 | 2.0222 | 2.0222 | |||
| RCL / Royal Caribbean Cruises Ltd. | 0.02 | -56.83 | 2.50 | -49.39 | 1.6275 | -1.6450 | |||
| LH / Labcorp Holdings Inc. | 0.01 | -31.38 | 1.97 | -16.96 | 1.2849 | 1.2849 | |||
| BMY / Bristol-Myers Squibb Company | 0.03 | 1.19 | 0.7770 | 0.7770 | |||||
| FRTA / Forterra Inc | 0.24 | -31.77 | 1.02 | -23.40 | 0.6630 | 0.6630 | |||
| EOG / EOG Resources, Inc. | 0.01 | 0.00 | 0.61 | 9.14 | 0.3966 | 0.0268 | |||
| STGW / Stagwell Inc. | 0.26 | -70.63 | 0.58 | -74.66 | 0.3777 | -1.1392 | |||
| CANF / Can-Fite BioPharma Ltd. - Depositary Receipt (Common Stock) | 0.54 | -32.38 | 0.47 | -53.09 | 0.3067 | -0.3586 | |||
| JPM / JPMorgan Chase & Co. | 0.00 | 0.45 | 0.2898 | 0.2898 | |||||
| DIS / The Walt Disney Company | 0.00 | 0.39 | 0.2527 | 0.2527 | |||||
| GOOGL / Alphabet Inc. | 0.00 | -7.58 | 0.36 | 4.06 | 0.2338 | 0.0052 | |||
| SWKS / Skyworks Solutions, Inc. | 0.00 | 0.00 | 0.35 | 23.13 | 0.2253 | 0.0391 | |||
| IBM / International Business Machines Corporation | 0.00 | 0.00 | 0.34 | 24.18 | 0.2208 | 0.2208 | |||
| CAT / Caterpillar Inc. | 0.00 | -10.91 | 0.33 | -5.14 | 0.2162 | 0.2162 | |||
| MSFT / Microsoft Corporation | 0.00 | -99.58 | 0.33 | -98.50 | 0.2149 | 0.2149 | |||
| CCK / Crown Holdings, Inc. | 0.01 | -16.67 | 0.27 | 9.64 | 0.1778 | 0.1778 | |||
| KR / The Kroger Co. | 0.01 | 17.20 | 0.27 | 4.69 | 0.1745 | 0.0049 | |||
| CVS / CVS Health Corporation | 0.00 | 27.03 | 0.25 | 4.53 | 0.1654 | 0.0044 | |||
| CSCO / Cisco Systems, Inc. | 0.00 | 0.24 | 0.1583 | 0.1583 | |||||
| JNJ / Johnson & Johnson | 0.00 | 0.24 | 0.1550 | 0.1550 | |||||
| ADI / Analog Devices, Inc. | 0.00 | 0.21 | 0.1368 | 0.1368 | |||||
| BPR / Brookfield Property REIT Inc. | 0.01 | 0.21 | 0.1342 | 0.1342 | |||||
| PEGI / Pattern Energy Group Inc. | 0.00 | -100.00 | 0.00 | -100.00 | -0.1630 | ||||
| CNQ / Canadian Natural Resources Limited | 0.00 | -100.00 | 0.00 | -100.00 | -9.5743 | ||||
| ECA / EnCana Corp. | 0.00 | -100.00 | 0.00 | -100.00 | -0.1750 | ||||
| ADNT / Adient plc | 0.00 | -100.00 | 0.00 | -100.00 | -0.0795 | ||||
| REVG / REV Group, Inc. | 0.00 | -100.00 | 0.00 | -100.00 | 0.0000 | ||||
| HPE / Hewlett Packard Enterprise Company | 0.00 | -100.00 | 0.00 | -100.00 | -0.1836 |