Basic Stats
| Portfolio Value | $ 260,717,241 |
| Current Positions | 45 |
Latest Holdings, Performance, AUM (from 13F, 13D)
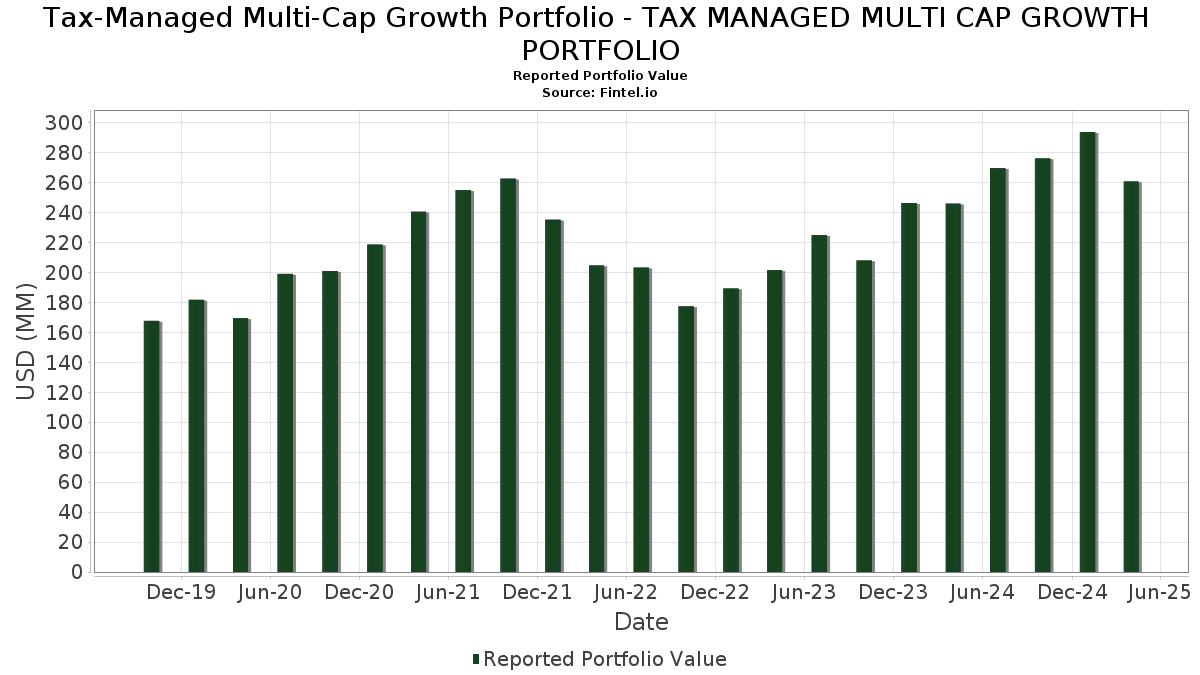
Tax-Managed Multi-Cap Growth Portfolio - TAX MANAGED MULTI CAP GROWTH PORTFOLIO has disclosed 45 total holdings in their latest SEC filings. Most recent portfolio value is calculated to be $ 260,717,241 USD. Actual Assets Under Management (AUM) is this value plus cash (which is not disclosed). Tax-Managed Multi-Cap Growth Portfolio - TAX MANAGED MULTI CAP GROWTH PORTFOLIO’s top holdings are Microsoft Corporation (US:MSFT) , Apple Inc. (US:AAPL) , Amazon.com, Inc. (US:AMZN) , NVIDIA Corporation (US:NVDA) , and Visa Inc. (US:V) . Tax-Managed Multi-Cap Growth Portfolio - TAX MANAGED MULTI CAP GROWTH PORTFOLIO’s new positions include State Street Navigator Securities Lending Government Money Market Portfolio (US:US8575093013) , .
Top Increases This Quarter
We use the change in the portfolio allocation because this is the most meaningful metric. Changes can be due to trades or changes in share prices.
| Security | Shares (MM) |
Value (MM$) |
Portfolio % | ΔPortfolio % |
|---|---|---|---|---|
| 0.07 | 29.39 | 11.3101 | 0.7963 | |
| 0.04 | 13.42 | 5.1650 | 0.6417 | |
| 0.05 | 3.84 | 1.4774 | 0.3981 | |
| 1.38 | 1.38 | 0.5295 | 0.3786 | |
| 0.16 | 17.52 | 6.7430 | 0.3256 | |
| 0.04 | 5.75 | 2.2119 | 0.3130 | |
| 0.01 | 6.10 | 2.3469 | 0.2995 | |
| 0.71 | 0.71 | 0.2738 | 0.2738 | |
| 0.00 | 3.75 | 1.4424 | 0.2561 | |
| 0.02 | 2.40 | 0.9249 | 0.2350 |
Top Decreases This Quarter
We use the change in the portfolio allocation because this is the most meaningful metric. Changes can be due to trades or changes in share prices.
| Security | Shares (MM) |
Value (MM$) |
Portfolio % | ΔPortfolio % |
|---|---|---|---|---|
| 0.12 | 21.78 | 8.3803 | -1.1808 | |
| 0.07 | 11.43 | 4.3990 | -0.6041 | |
| 0.07 | 11.88 | 4.5710 | -0.5999 | |
| 0.02 | 11.26 | 4.3344 | -0.4823 | |
| 0.04 | 7.10 | 2.7324 | -0.4683 | |
| 0.01 | 2.43 | 0.9358 | -0.3801 | |
| 0.03 | 7.40 | 2.8469 | -0.3579 | |
| 0.01 | 3.41 | 1.3119 | -0.2194 | |
| 0.01 | 5.06 | 1.9477 | -0.1315 | |
| 0.01 | 1.13 | 0.4356 | -0.1294 |
13F and Fund Filings
This form was filed on 2025-06-23 for the reporting period 2025-04-30. Click the link icon to see the full transaction history.
Upgrade to unlock premium data and export to Excel ![]() .
.
| Security | Type | Avg Share Price | Shares (MM) |
ΔShares (%) |
ΔShares (%) |
Value ($MM) |
Portfolio (%) |
ΔPortfolio (%) |
|
|---|---|---|---|---|---|---|---|---|---|
| MSFT / Microsoft Corporation | 0.07 | 0.00 | 29.39 | -4.77 | 11.3101 | 0.7963 | |||
| AAPL / Apple Inc. | 0.12 | 0.00 | 24.74 | -9.96 | 9.5195 | 0.1605 | |||
| AMZN / Amazon.com, Inc. | 0.12 | 0.00 | 21.78 | -22.41 | 8.3803 | -1.1808 | |||
| NVDA / NVIDIA Corporation | 0.16 | 2.54 | 17.52 | -6.98 | 6.7430 | 0.3256 | |||
| V / Visa Inc. | 0.04 | 0.00 | 13.42 | 1.08 | 5.1650 | 0.6417 | |||
| GOOG / Alphabet Inc. | 0.07 | 0.00 | 11.88 | -21.75 | 4.5710 | -0.5999 | |||
| GOOGL / Alphabet Inc. | 0.07 | 0.00 | 11.43 | -22.17 | 4.3990 | -0.6041 | |||
| META / Meta Platforms, Inc. | 0.02 | 0.00 | 11.26 | -20.34 | 4.3344 | -0.4823 | |||
| CRM / Salesforce, Inc. | 0.03 | 0.00 | 7.40 | -21.37 | 2.8469 | -0.3579 | |||
| GDDY / GoDaddy Inc. | 0.04 | -14.67 | 7.10 | -24.43 | 2.7324 | -0.4683 | |||
| VRTX / Vertex Pharmaceuticals Incorporated | 0.01 | -8.05 | 6.10 | 1.48 | 2.3469 | 0.2995 | |||
| TJX / The TJX Companies, Inc. | 0.04 | 0.00 | 5.75 | 3.12 | 2.2119 | 0.3130 | |||
| AME / AMETEK, Inc. | 0.03 | -7.87 | 5.36 | -15.36 | 2.0623 | -0.0944 | |||
| MPWR / Monolithic Power Systems, Inc. | 0.01 | 0.00 | 5.25 | -6.95 | 2.0210 | 0.0984 | |||
| URI / United Rentals, Inc. | 0.01 | -0.45 | 5.06 | -17.07 | 1.9477 | -0.1315 | |||
| PFGC / Performance Food Group Company | 0.06 | 0.00 | 4.72 | -10.69 | 1.8164 | 0.0161 | |||
| SYK / Stryker Corporation | 0.01 | -4.25 | 4.54 | -8.49 | 1.7454 | 0.0567 | |||
| INTU / Intuit Inc. | 0.01 | 0.00 | 4.02 | 4.30 | 1.5489 | 0.2345 | |||
| ADBE / Adobe Inc. | 0.01 | 0.00 | 3.96 | -14.29 | 1.5239 | -0.0499 | |||
| UBER / Uber Technologies, Inc. | 0.05 | 0.00 | 3.84 | 21.19 | 1.4774 | 0.3981 | |||
| ISRG / Intuitive Surgical, Inc. | 0.01 | 0.00 | 3.82 | -9.81 | 1.4719 | 0.0272 | |||
| BKNG / Booking Holdings Inc. | 0.00 | 0.00 | 3.75 | 7.61 | 1.4424 | 0.2561 | |||
| UNH / UnitedHealth Group Incorporated | 0.01 | 0.00 | 3.41 | -24.17 | 1.3119 | -0.2194 | |||
| WCN / Waste Connections, Inc. | 0.02 | 0.00 | 3.19 | 7.55 | 1.2288 | 0.2173 | |||
| ZTS / Zoetis Inc. | 0.02 | -5.09 | 3.18 | -13.15 | 1.2255 | -0.0235 | |||
| CPRT / Copart, Inc. | 0.05 | 0.00 | 3.02 | 5.38 | 1.1607 | 0.1854 | |||
| SPGI / S&P Global Inc. | 0.01 | 0.00 | 2.98 | -4.08 | 1.1481 | 0.0883 | |||
| FI / Fiserv, Inc. | 0.01 | 0.00 | 2.58 | -14.55 | 0.9926 | -0.0359 | |||
| LULU / lululemon athletica inc. | 0.01 | -3.70 | 2.43 | -37.05 | 0.9358 | -0.3801 | |||
| BJ / BJ's Wholesale Club Holdings, Inc. | 0.02 | 0.00 | 2.40 | 18.73 | 0.9249 | 0.2350 | |||
| MDLZ / Mondelez International, Inc. | 0.04 | 0.00 | 2.39 | 17.47 | 0.9215 | 0.2271 | |||
| DHR / Danaher Corporation | 0.01 | 0.00 | 2.37 | -10.52 | 0.9104 | 0.0098 | |||
| SHW / The Sherwin-Williams Company | 0.01 | 0.00 | 2.32 | -1.49 | 0.8923 | 0.0907 | |||
| ACN / Accenture plc | 0.01 | 0.00 | 2.30 | -22.29 | 0.8856 | -0.1232 | |||
| NSC / Norfolk Southern Corporation | 0.01 | 0.00 | 1.96 | -12.25 | 0.7531 | -0.0066 | |||
| ECL / Ecolab Inc. | 0.01 | 0.00 | 1.89 | 0.48 | 0.7287 | 0.0868 | |||
| JBHT / J.B. Hunt Transport Services, Inc. | 0.01 | 0.00 | 1.84 | -23.74 | 0.7086 | -0.1139 | |||
| OKTA / Okta, Inc. | 0.02 | 0.00 | 1.69 | 19.07 | 0.6490 | 0.1664 | |||
| IT / Gartner, Inc. | 0.00 | 0.00 | 1.61 | -22.43 | 0.6177 | -0.0872 | |||
| NTNX / Nutanix, Inc. | 0.02 | 0.00 | 1.56 | -0.06 | 0.6009 | 0.0685 | |||
| FSV / FirstService Corporation | 0.01 | 0.00 | 1.38 | -3.43 | 0.5304 | 0.0439 | |||
| US61747C7074 / Morgan Stanley Institutional Liquidity Funds Government Portfolio, Institutional Class | 1.38 | 210.56 | 1.38 | 210.38 | 0.5295 | 0.3786 | |||
| FOUR / Shift4 Payments, Inc. | 0.01 | 0.00 | 1.13 | -31.79 | 0.4356 | -0.1294 | |||
| TREX / Trex Company, Inc. | 0.02 | 0.00 | 0.92 | -20.66 | 0.3536 | -0.0407 | |||
| US8575093013 / State Street Navigator Securities Lending Government Money Market Portfolio | 0.71 | 0.71 | 0.2738 | 0.2738 |