Basic Stats
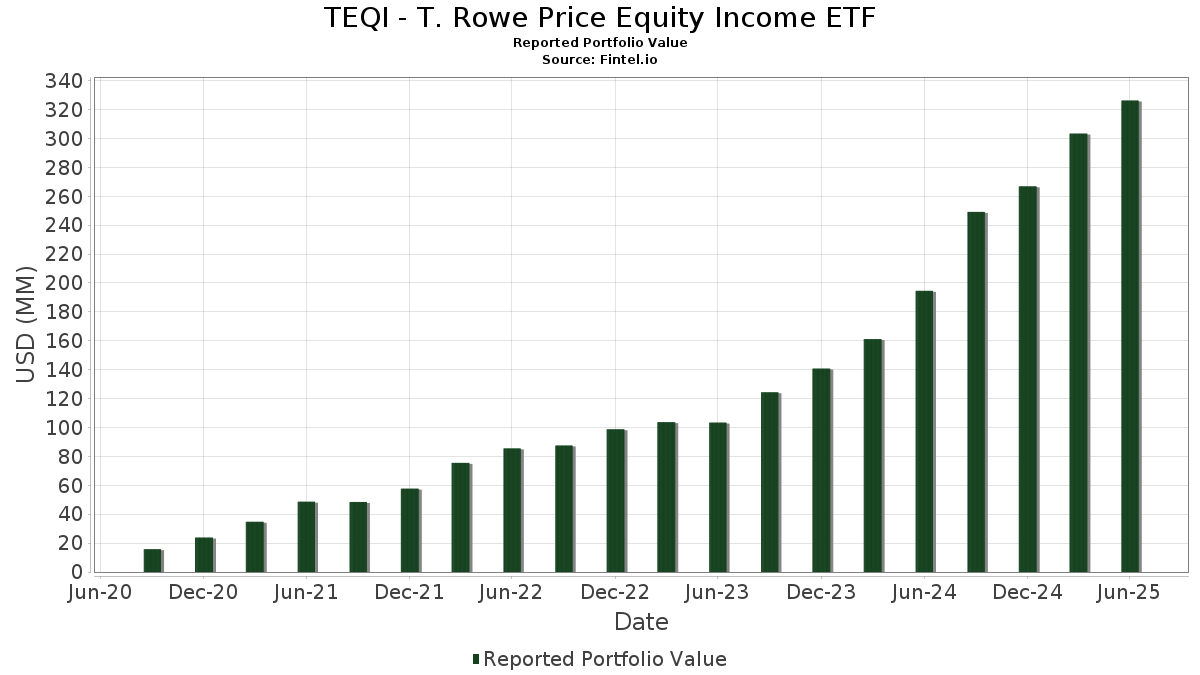
| Portfolio Value | $ 326,211,198 |
| Current Positions | 132 |
Latest Holdings, Performance, AUM (from 13F, 13D)
TEQI - T. Rowe Price Equity Income ETF has disclosed 132 total holdings in their latest SEC filings. Most recent portfolio value is calculated to be $ 326,211,198 USD. Actual Assets Under Management (AUM) is this value plus cash (which is not disclosed). TEQI - T. Rowe Price Equity Income ETF’s top holdings are T ROWE PRICE GOVERNMENT RESERVE INVESTMENT FUND - Collateral (US:76105YYY8) , MetLife, Inc. (US:MET) , The Southern Company (US:SO) , QUALCOMM Incorporated (US:QCOM) , and The Charles Schwab Corporation (US:SCHW) . TEQI - T. Rowe Price Equity Income ETF’s new positions include Amazon.com, Inc. (US:AMZN) , Alphabet Inc. (US:GOOGL) , The Procter & Gamble Company (US:PG) , Alphabet Inc. (US:GOOG) , and The Allstate Corporation (US:ALL) .
Top Increases This Quarter
We use the change in the portfolio allocation because this is the most meaningful metric. Changes can be due to trades or changes in share prices.
| Security | Shares (MM) |
Value (MM$) |
Portfolio % | ΔPortfolio % |
|---|---|---|---|---|
| 0.02 | 5.36 | 1.6736 | 1.6736 | |
| 0.02 | 4.03 | 1.2589 | 1.2589 | |
| 0.02 | 3.48 | 1.0866 | 1.0866 | |
| 0.02 | 3.15 | 0.9831 | 0.9831 | |
| 0.01 | 3.62 | 1.1295 | 0.9292 | |
| 7.13 | 7.13 | 2.2282 | 0.7738 | |
| 0.01 | 1.97 | 0.6147 | 0.6147 | |
| 0.00 | 1.89 | 0.5915 | 0.5915 | |
| 0.01 | 2.56 | 0.8004 | 0.5638 | |
| 0.04 | 1.51 | 0.4722 | 0.4722 |
Top Decreases This Quarter
We use the change in the portfolio allocation because this is the most meaningful metric. Changes can be due to trades or changes in share prices.
| Security | Shares (MM) |
Value (MM$) |
Portfolio % | ΔPortfolio % |
|---|---|---|---|---|
| 0.00 | 0.50 | 0.1558 | -0.6758 | |
| 0.01 | 2.56 | 0.7985 | -0.5320 | |
| 0.22 | 4.51 | 1.4079 | -0.4748 | |
| 0.02 | 4.12 | 1.2859 | -0.4689 | |
| 0.12 | 0.12 | 0.0371 | -0.4687 | |
| 0.04 | 3.84 | 1.2006 | -0.4672 | |
| 0.05 | 2.33 | 0.7279 | -0.4585 | |
| 0.00 | 0.06 | 0.0201 | -0.4323 | |
| 0.00 | 0.07 | 0.0205 | -0.4299 | |
| 0.04 | 4.22 | 1.3189 | -0.4043 |
13F and Fund Filings
This form was filed on 2025-08-26 for the reporting period 2025-06-30. Click the link icon to see the full transaction history.
Upgrade to unlock premium data and export to Excel ![]() .
.
| Security | Type | Avg Share Price | Shares (MM) |
ΔShares (%) |
ΔShares (%) |
Value ($MM) |
Portfolio (%) |
ΔPortfolio (%) |
|
|---|---|---|---|---|---|---|---|---|---|
| 76105YYY8 / T ROWE PRICE GOVERNMENT RESERVE INVESTMENT FUND - Collateral | 7.13 | 63.76 | 7.13 | 63.74 | 2.2282 | 0.7738 | |||
| MET / MetLife, Inc. | 0.09 | 3.90 | 6.90 | 4.06 | 2.1557 | -0.0584 | |||
| SO / The Southern Company | 0.07 | 5.27 | 6.49 | 5.14 | 2.0265 | -0.0337 | |||
| QCOM / QUALCOMM Incorporated | 0.04 | 8.15 | 6.40 | 12.12 | 2.0000 | 0.0934 | |||
| SCHW / The Charles Schwab Corporation | 0.07 | -6.05 | 6.15 | 9.50 | 1.9205 | 0.0459 | |||
| WFC / Wells Fargo & Company | 0.08 | -16.94 | 6.07 | -7.29 | 1.8953 | -0.2900 | |||
| ELV / Elevance Health, Inc. | 0.02 | 5.18 | 6.00 | -5.94 | 1.8738 | -0.2555 | |||
| JPM / JPMorgan Chase & Co. | 0.02 | 2.60 | 5.96 | 21.24 | 1.8620 | 0.2206 | |||
| BA / The Boeing Company | 0.03 | 3.29 | 5.86 | 26.89 | 1.8298 | 0.2886 | |||
| C / Citigroup Inc. | 0.07 | 3.49 | 5.71 | 24.11 | 1.7853 | 0.2475 | |||
| LHX / L3Harris Technologies, Inc. | 0.02 | -6.20 | 5.68 | 12.40 | 1.7758 | 0.0873 | |||
| KMB / Kimberly-Clark Corporation | 0.04 | 9.55 | 5.47 | -0.69 | 1.7083 | -0.1304 | |||
| TTE / TotalEnergies SE - Depositary Receipt (Common Stock) | 0.09 | 0.65 | 5.37 | -4.48 | 1.6771 | -0.1997 | |||
| AMZN / Amazon.com, Inc. | 0.02 | 5.36 | 1.6736 | 1.6736 | |||||
| PM / Philip Morris International Inc. | 0.03 | -16.96 | 5.08 | -4.73 | 1.5873 | -0.1934 | |||
| EQH / Equitable Holdings, Inc. | 0.09 | -6.94 | 4.96 | 0.22 | 1.5505 | -0.1031 | |||
| CB / Chubb Limited | 0.02 | -11.00 | 4.94 | -14.61 | 1.5435 | -0.3886 | |||
| EQR / Equity Residential | 0.07 | 8.52 | 4.75 | 2.31 | 1.4826 | -0.0662 | |||
| KVUE / Kenvue Inc. | 0.22 | -8.42 | 4.51 | -20.06 | 1.4079 | -0.4748 | |||
| CF / CF Industries Holdings, Inc. | 0.05 | -0.39 | 4.47 | 17.26 | 1.3970 | 0.1236 | |||
| BDX / Becton, Dickinson and Company | 0.03 | 14.43 | 4.43 | -13.96 | 1.3833 | -0.3350 | |||
| ZBH / Zimmer Biomet Holdings, Inc. | 0.05 | 8.61 | 4.31 | -12.48 | 1.3457 | -0.2977 | |||
| COP / ConocoPhillips | 0.05 | 32.76 | 4.25 | 13.43 | 1.3274 | 0.0767 | |||
| XOM / Exxon Mobil Corporation | 0.04 | -9.74 | 4.22 | -18.20 | 1.3189 | -0.4043 | |||
| IP / International Paper Company | 0.09 | 9.73 | 4.20 | -3.67 | 1.3107 | -0.1438 | |||
| CVS / CVS Health Corporation | 0.06 | 5.36 | 4.19 | 7.25 | 1.3077 | 0.0047 | |||
| GE / General Electric Company | 0.02 | -39.09 | 4.12 | -21.68 | 1.2859 | -0.4689 | |||
| GOOGL / Alphabet Inc. | 0.02 | 4.03 | 1.2589 | 1.2589 | |||||
| AEE / Ameren Corporation | 0.04 | 5.46 | 3.92 | 0.90 | 1.2242 | -0.0728 | |||
| AIG / American International Group, Inc. | 0.04 | -21.84 | 3.84 | -23.07 | 1.2006 | -0.4672 | |||
| DIS / The Walt Disney Company | 0.03 | 1.33 | 3.75 | 27.34 | 1.1729 | 0.1881 | |||
| CL / Colgate-Palmolive Company | 0.04 | 34.30 | 3.66 | 30.30 | 1.1449 | 0.2056 | |||
| SWK / Stanley Black & Decker, Inc. | 0.05 | 9.63 | 3.65 | -3.37 | 1.1392 | -0.1211 | |||
| CRM / Salesforce, Inc. | 0.01 | 493.20 | 3.62 | 503.51 | 1.1295 | 0.9292 | |||
| BAC / Bank of America Corporation | 0.08 | 4.87 | 3.61 | 18.94 | 1.1283 | 0.1142 | |||
| HIG / The Hartford Insurance Group, Inc. | 0.03 | -22.65 | 3.59 | -20.70 | 1.1219 | -0.3900 | |||
| NWSA / News Corporation | 0.12 | -21.36 | 3.51 | -14.14 | 1.0953 | -0.2682 | |||
| MSFT / Microsoft Corporation | 0.01 | -25.70 | 3.49 | -1.55 | 1.0897 | -0.0934 | |||
| LVS / Las Vegas Sands Corp. | 0.08 | 9.85 | 3.49 | 23.70 | 1.0894 | 0.1483 | |||
| PG / The Procter & Gamble Company | 0.02 | 3.48 | 1.0866 | 1.0866 | |||||
| HBAN / Huntington Bancshares Incorporated | 0.21 | -11.84 | 3.48 | -1.56 | 1.0861 | -0.0932 | |||
| TXN / Texas Instruments Incorporated | 0.02 | 11.55 | 3.45 | 28.90 | 1.0785 | 0.1841 | |||
| CI / The Cigna Group | 0.01 | 5.43 | 3.42 | 5.92 | 1.0671 | -0.0096 | |||
| WY / Weyerhaeuser Company | 0.13 | -11.35 | 3.41 | -22.22 | 1.0654 | -0.3986 | |||
| CSX / CSX Corporation | 0.10 | 34.63 | 3.35 | 49.33 | 1.0470 | 0.2973 | |||
| LUV / Southwest Airlines Co. | 0.10 | 5.38 | 3.27 | 1.81 | 1.0205 | -0.0510 | |||
| FITB / Fifth Third Bancorp | 0.08 | 8.12 | 3.15 | 13.45 | 0.9835 | 0.0568 | |||
| GOOG / Alphabet Inc. | 0.02 | 3.15 | 0.9831 | 0.9831 | |||||
| L / Loews Corporation | 0.03 | -9.08 | 3.15 | -9.34 | 0.9829 | -0.1758 | |||
| USB / U.S. Bancorp | 0.07 | 16.84 | 3.00 | 25.23 | 0.9384 | 0.1375 | |||
| MDT / Medtronic plc | 0.03 | -7.96 | 2.79 | -10.71 | 0.8702 | -0.1715 | |||
| FI / Fiserv, Inc. | 0.02 | -0.90 | 2.78 | -22.65 | 0.8688 | -0.3315 | |||
| NXPI / NXP Semiconductors N.V. | 0.01 | 11.32 | 2.71 | 28.00 | 0.8455 | 0.1393 | |||
| ACN / Accenture plc | 0.01 | 6.42 | 2.68 | 1.94 | 0.8389 | -0.0407 | |||
| NEE / NextEra Energy, Inc. | 0.04 | 4.52 | 2.67 | 2.34 | 0.8344 | -0.0370 | |||
| SRE / Sempra | 0.04 | 5.18 | 2.67 | 11.68 | 0.8337 | 0.0358 | |||
| UPS / United Parcel Service, Inc. | 0.03 | 5.20 | 2.64 | -3.48 | 0.8244 | -0.0883 | |||
| HD / The Home Depot, Inc. | 0.01 | 261.46 | 2.56 | 261.72 | 0.8004 | 0.5638 | |||
| UNH / UnitedHealth Group Incorporated | 0.01 | 7.69 | 2.56 | -35.87 | 0.7985 | -0.5320 | |||
| TSN / Tyson Foods, Inc. | 0.05 | 10.30 | 2.53 | -3.28 | 0.7911 | -0.0834 | |||
| D / Dominion Energy, Inc. | 0.04 | -9.41 | 2.48 | -8.70 | 0.7741 | -0.1319 | |||
| SNY / Sanofi - Depositary Receipt (Common Stock) | 0.05 | -24.72 | 2.33 | -34.43 | 0.7279 | -0.4585 | |||
| SLB / Schlumberger Limited | 0.07 | 32.80 | 2.25 | 7.38 | 0.7043 | 0.0032 | |||
| AMAT / Applied Materials, Inc. | 0.01 | 5.65 | 2.19 | 33.29 | 0.6845 | 0.1356 | |||
| FTV / Fortive Corporation | 0.04 | 135.79 | 2.19 | 68.05 | 0.6836 | 0.2486 | |||
| VTRS / Viatris Inc. | 0.24 | 8.27 | 2.18 | 10.98 | 0.6826 | 0.0254 | |||
| ROK / Rockwell Automation, Inc. | 0.01 | 12.82 | 2.15 | 45.05 | 0.6731 | 0.1771 | |||
| WMT / Walmart Inc. | 0.02 | -40.98 | 2.05 | -34.27 | 0.6390 | -0.4001 | |||
| CMI / Cummins Inc. | 0.01 | 5.25 | 2.00 | 9.97 | 0.6238 | 0.0175 | |||
| AZN / AstraZeneca PLC - Depositary Receipt (Common Stock) | 0.03 | 9.60 | 1.99 | 4.25 | 0.6208 | -0.0160 | |||
| MRK / Merck & Co., Inc. | 0.03 | 274.72 | 1.98 | 230.67 | 0.6199 | 0.4194 | |||
| ALL / The Allstate Corporation | 0.01 | 1.97 | 0.6147 | 0.6147 | |||||
| WMB / The Williams Companies, Inc. | 0.03 | -11.89 | 1.96 | -7.40 | 0.6138 | -0.0946 | |||
| META / Meta Platforms, Inc. | 0.00 | 1.89 | 0.5915 | 0.5915 | |||||
| NSC / Norfolk Southern Corporation | 0.01 | 5.47 | 1.88 | 14.04 | 0.5861 | 0.0365 | |||
| EXE / Expand Energy Corporation | 0.02 | 44.06 | 1.85 | 51.39 | 0.5790 | 0.1701 | |||
| EQT / EQT Corporation | 0.03 | -22.91 | 1.85 | -15.87 | 0.5782 | -0.1563 | |||
| CMCSA / Comcast Corporation | 0.05 | 5.69 | 1.79 | 2.22 | 0.5603 | -0.0256 | |||
| REXR / Rexford Industrial Realty, Inc. | 0.05 | 19.93 | 1.74 | 8.95 | 0.5438 | 0.0104 | |||
| RYN / Rayonier Inc. | 0.08 | 13.44 | 1.69 | -9.72 | 0.5281 | -0.0974 | |||
| STT / State Street Corporation | 0.02 | 133.16 | 1.60 | 176.99 | 0.5004 | 0.3073 | |||
| AMD / Advanced Micro Devices, Inc. | 0.01 | 18.89 | 1.57 | 64.26 | 0.4913 | 0.1715 | |||
| GM / General Motors Company | 0.03 | 0.95 | 1.56 | 5.69 | 0.4878 | -0.0058 | |||
| US21871X1090 / Corebridge Financial, Inc. | 0.04 | 1.51 | 0.4722 | 0.4722 | |||||
| PSX / Phillips 66 | 0.01 | 112.71 | 1.47 | 105.76 | 0.4578 | 0.2197 | |||
| JNJ / Johnson & Johnson | 0.01 | -28.54 | 1.44 | -34.17 | 0.4509 | -0.2813 | |||
| TRP / TC Energy Corporation | 0.03 | -1.74 | 1.41 | 1.59 | 0.4402 | -0.0231 | |||
| SOBO / South Bow Corporation | 0.05 | 3.79 | 1.34 | 5.36 | 0.4177 | -0.0060 | |||
| EOG / EOG Resources, Inc. | 0.01 | 12.15 | 1.33 | 4.56 | 0.4157 | -0.0091 | |||
| MAT / Mattel, Inc. | 0.07 | -6.53 | 1.32 | -5.10 | 0.4128 | -0.0523 | |||
| TMO / Thermo Fisher Scientific Inc. | 0.00 | 5.12 | 1.27 | -14.35 | 0.3954 | -0.0980 | |||
| BMY / Bristol-Myers Squibb Company | 0.03 | 18.44 | 1.26 | -10.09 | 0.3925 | -0.0742 | |||
| INTC / Intel Corporation | 0.06 | 21.80 | 1.25 | 20.19 | 0.3906 | 0.0431 | |||
| AGCO / AGCO Corporation | 0.01 | 0.00 | 1.20 | 11.40 | 0.3758 | 0.0154 | |||
| WFG / West Fraser Timber Co. Ltd. | 0.02 | 24.87 | 1.12 | 18.96 | 0.3509 | 0.0356 | |||
| HES / Hess Corporation | 0.01 | 24.06 | 1.03 | 7.67 | 0.3203 | 0.0021 | |||
| CAG / Conagra Brands, Inc. | 0.05 | -21.35 | 1.01 | -39.63 | 0.3157 | -0.2433 | |||
| ADBE / Adobe Inc. | 0.00 | -25.87 | 1.00 | -25.23 | 0.3114 | -0.1337 | |||
| DG / Dollar General Corporation | 0.01 | -27.50 | 0.94 | -5.75 | 0.2923 | -0.0390 | |||
| VZ / Verizon Communications Inc. | 0.02 | -1.88 | 0.89 | -6.39 | 0.2791 | -0.0396 | |||
| MMM / 3M Company | 0.01 | -21.22 | 0.89 | -18.32 | 0.2788 | -0.0861 | |||
| APO / Apollo Global Management, Inc. | 0.01 | -9.29 | 0.88 | -6.07 | 0.2758 | -0.0379 | |||
| CVX / Chevron Corporation | 0.01 | 518.37 | 0.82 | 431.61 | 0.2576 | 0.2055 | |||
| MS / Morgan Stanley | 0.01 | -5.64 | 0.79 | 13.85 | 0.2467 | 0.0152 | |||
| BIIB / Biogen Inc. | 0.01 | 5.30 | 0.76 | -3.44 | 0.2371 | -0.0251 | |||
| XEL / Xcel Energy Inc. | 0.01 | 0.73 | 0.2268 | 0.2268 | |||||
| RAL / Ralliant Corporation | 0.01 | 0.68 | 0.2120 | 0.2120 | |||||
| FERG / Ferguson Enterprises Inc. | 0.00 | -55.54 | 0.59 | -39.63 | 0.1831 | -0.1408 | |||
| SUI / Sun Communities, Inc. | 0.00 | 0.54 | 0.1696 | 0.1696 | |||||
| T / AT&T Inc. | 0.02 | -5.19 | 0.50 | -3.10 | 0.1564 | -0.0159 | |||
| TEL / TE Connectivity plc | 0.00 | -83.22 | 0.50 | -80.00 | 0.1558 | -0.6758 | |||
| GPN / Global Payments Inc. | 0.01 | 0.46 | 0.1431 | 0.1431 | |||||
| KDP / Keurig Dr Pepper Inc. | 0.01 | 5.21 | 0.36 | 1.68 | 0.1139 | -0.0059 | |||
| HUM / Humana Inc. | 0.00 | 5.39 | 0.36 | -2.68 | 0.1136 | -0.0111 | |||
| CAH / Cardinal Health, Inc. | 0.00 | -55.46 | 0.31 | -45.77 | 0.0983 | -0.0951 | |||
| PCG / PG&E Corporation | 0.01 | 5.01 | 0.19 | -14.48 | 0.0591 | -0.0150 | |||
| GVMXX / State Street Institutional Investment Trust - State Street Institutional US Govt Money Market Fnd Premier Cls | 0.12 | -92.17 | 0.12 | -92.21 | 0.0371 | -0.4687 | |||
| CSCO / Cisco Systems, Inc. | 0.00 | -88.75 | 0.07 | -87.41 | 0.0220 | -0.1639 | |||
| GEV / GE Vernova Inc. | 0.00 | -96.36 | 0.07 | -93.71 | 0.0217 | -0.3449 | |||
| KSS / Kohl's Corporation | 0.01 | -74.15 | 0.07 | -73.15 | 0.0216 | -0.0645 | |||
| CNC / Centene Corporation | 0.00 | -80.06 | 0.07 | -82.40 | 0.0209 | -0.1044 | |||
| SU / Suncor Energy Inc. | 0.00 | -94.97 | 0.07 | -95.18 | 0.0205 | -0.4299 | |||
| VNO / Vornado Realty Trust | 0.00 | -61.21 | 0.07 | -59.88 | 0.0204 | -0.0340 | |||
| ABBV / AbbVie Inc. | 0.00 | -90.94 | 0.06 | -92.02 | 0.0201 | -0.2480 | |||
| PFE / Pfizer Inc. | 0.00 | -95.04 | 0.06 | -95.27 | 0.0201 | -0.4323 | |||
| TJX / The TJX Companies, Inc. | 0.00 | -94.64 | 0.06 | -94.65 | 0.0197 | -0.3675 | |||
| BKR / Baker Hughes Company | 0.00 | -81.16 | 0.06 | -83.57 | 0.0178 | -0.0981 | |||
| GEHC / GE HealthCare Technologies Inc. | 0.00 | -88.05 | 0.05 | -89.15 | 0.0161 | -0.1409 | |||
| NWS / News Corporation | 0.00 | 0.00 | 0.04 | 11.43 | 0.0124 | 0.0007 | |||
| ENB / Enbridge Inc. | 0.00 | -93.57 | 0.03 | -93.60 | 0.0106 | -0.1619 | |||
| ATO / Atmos Energy Corporation | 0.00 | -83.22 | 0.03 | -83.33 | 0.0104 | -0.0558 | |||
| NI / NiSource Inc. | 0.00 | -99.68 | 0.00 | -100.00 | 0.0003 | -0.0824 |