Basic Stats
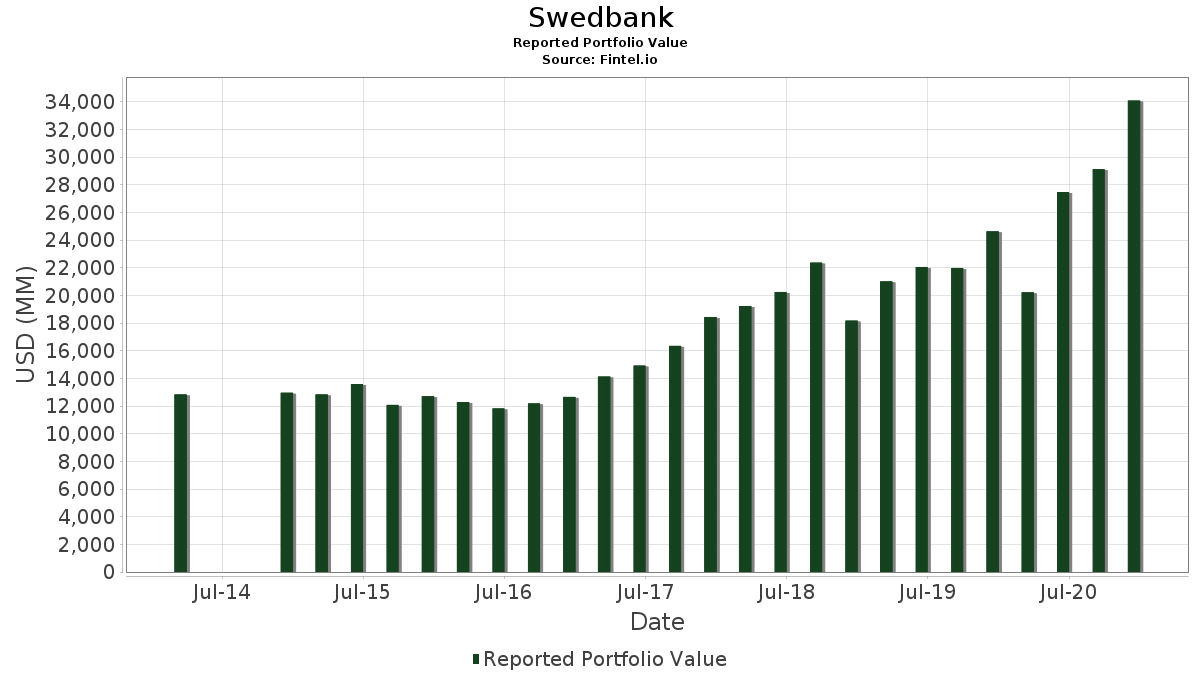
| Portfolio Value | $ 34,095,644,000 |
| Current Positions | 126 |
Latest Holdings, Performance, AUM (from 13F, 13D)
Swedbank has disclosed 126 total holdings in their latest SEC filings. Most recent portfolio value is calculated to be $ 34,095,644,000 USD. Actual Assets Under Management (AUM) is this value plus cash (which is not disclosed). Swedbank’s top holdings are Microsoft Corporation (US:MSFT) , Apple Inc. (US:AAPL) , Amazon.com, Inc. (US:AMZN) , Adobe Inc. (US:ADBE) , and PayPal Holdings, Inc. (US:PYPL) . Swedbank’s new positions include Dollar General Corporation (US:DG) , Yandex N.V. (US:YNDX) , Veeva Systems Inc. (US:VEEV) , Farfetch Limited (US:FTCH) , and ON Semiconductor Corporation (US:ON) .
Top Increases This Quarter
We use the change in the portfolio allocation because this is the most meaningful metric. Changes can be due to trades or changes in share prices.
| Security | Shares (MM) |
Value (MM$) |
Portfolio % | ΔPortfolio % |
|---|---|---|---|---|
| 2.30 | 483.95 | 1.4194 | 0.6236 | |
| 0.80 | 167.72 | 0.4919 | 0.4919 | |
| 4.22 | 528.79 | 1.5509 | 0.4633 | |
| 0.53 | 145.08 | 0.4255 | 0.4255 | |
| 2.19 | 141.47 | 0.4149 | 0.4149 | |
| 4.35 | 141.36 | 0.4146 | 0.4146 | |
| 0.19 | 133.61 | 0.3919 | 0.3919 | |
| 0.30 | 133.17 | 0.3906 | 0.3906 | |
| 0.75 | 129.41 | 0.3795 | 0.3795 | |
| 1.04 | 124.05 | 0.3638 | 0.3638 |
Top Decreases This Quarter
We use the change in the portfolio allocation because this is the most meaningful metric. Changes can be due to trades or changes in share prices.
| Security | Shares (MM) |
Value (MM$) |
Portfolio % | ΔPortfolio % |
|---|---|---|---|---|
| 1.16 | 411.37 | 1.2065 | -1.4132 | |
| 0.13 | 47.53 | 0.1394 | -0.8647 | |
| 1.48 | 329.69 | 0.9670 | -0.8645 | |
| 0.00 | 0.00 | -0.4450 | ||
| 0.22 | 79.17 | 0.2322 | -0.4260 | |
| 3.83 | 186.77 | 0.5478 | -0.3888 | |
| 2.56 | 1,273.35 | 3.7346 | -0.3587 | |
| 0.57 | 30.34 | 0.0890 | -0.3459 | |
| 11.09 | 2,459.42 | 7.2133 | -0.2988 | |
| 2.01 | 438.29 | 1.2855 | -0.2907 |
13F and Fund Filings
This form was filed on 2021-02-09 for the reporting period 2020-12-31. Click the link icon to see the full transaction history.
Upgrade to unlock premium data and export to Excel ![]() .
.
| Security | Type | Avg Share Price | Shares (MM) |
ΔShares (%) |
ΔShares (%) |
Value ($MM) |
Portfolio (%) |
ΔPortfolio (%) |
|
|---|---|---|---|---|---|---|---|---|---|
| MSFT / Microsoft Corporation | 11.09 | 6.62 | 2,459.42 | 12.37 | 7.2133 | -0.2988 | |||
| AAPL / Apple Inc. | 15.00 | -0.83 | 2,005.51 | 14.51 | 5.8820 | -0.1294 | |||
| AMZN / Amazon.com, Inc. | 0.45 | 5.60 | 1,470.45 | 10.20 | 4.3127 | -0.2672 | |||
| ADBE / Adobe Inc. | 2.56 | 5.26 | 1,273.35 | 6.77 | 3.7346 | -0.3587 | |||
| PYPL / PayPal Holdings, Inc. | 4.74 | -2.66 | 1,097.73 | 14.38 | 3.2196 | -0.0746 | |||
| NVDA / NVIDIA Corporation | 1.68 | 9.90 | 882.59 | 6.77 | 2.5886 | -0.2486 | |||
| SEDG / SolarEdge Technologies, Inc. | 2.74 | -11.77 | 874.52 | 18.12 | 2.5649 | 0.0237 | |||
| GOOGL / Alphabet Inc. | 0.48 | -8.91 | 830.45 | 7.92 | 2.4357 | -0.2056 | |||
| GOOG / Alphabet Inc. | 0.45 | -4.57 | 779.96 | 12.95 | 2.2876 | -0.0825 | |||
| VMW / Vmware Inc. - Class A | 5.10 | 20.13 | 704.72 | 15.43 | 2.0669 | -0.0285 | |||
| NOW / ServiceNow, Inc. | 1.29 | 6.44 | 703.51 | 20.13 | 2.0633 | 0.0533 | |||
| JPM / JPMorgan Chase & Co. | 4.22 | 28.16 | 528.79 | 66.88 | 1.5509 | 0.4633 | |||
| UNH / UnitedHealth Group Incorporated | 1.50 | 1.45 | 517.97 | 12.26 | 1.5192 | -0.0645 | |||
| SNPS / Synopsys, Inc. | 1.96 | 0.48 | 504.76 | 20.64 | 1.4804 | 0.0443 | |||
| PLD / Prologis, Inc. | 5.07 | 6.15 | 501.42 | 4.25 | 1.4706 | -0.1802 | |||
| GPN / Global Payments Inc. | 2.30 | 76.39 | 483.95 | 108.73 | 1.4194 | 0.6236 | |||
| KEYS / Keysight Technologies, Inc. | 3.63 | 5.55 | 476.85 | 40.23 | 1.3986 | 0.2314 | |||
| TMO / Thermo Fisher Scientific Inc. | 0.99 | 48.40 | 457.70 | 55.20 | 1.3424 | 0.3302 | |||
| V / Visa Inc. | 2.01 | -12.60 | 438.29 | -4.56 | 1.2855 | -0.2907 | |||
| PINS / Pinterest, Inc. | 6.20 | -13.52 | 416.49 | 39.87 | 1.2215 | 0.1995 | |||
| META / Meta Platforms, Inc. | 1.53 | -8.98 | 414.76 | -5.51 | 1.2165 | -0.2902 | |||
| MA / Mastercard Incorporated | 1.16 | -48.74 | 411.37 | -46.10 | 1.2065 | -1.4132 | |||
| ABT / Abbott Laboratories | 3.75 | 24.62 | 406.47 | 24.17 | 1.1921 | 0.0686 | |||
| SPGI / S&P Global Inc. | 1.23 | 60.72 | 397.40 | 44.24 | 1.1656 | 0.2199 | |||
| MRK / Merck & Co., Inc. | 4.39 | 2.92 | 353.68 | 0.00 | 1.0373 | -0.1767 | |||
| CSCO / Cisco Systems, Inc. | 7.64 | 4.56 | 340.01 | 18.07 | 0.9972 | 0.0088 | |||
| US0153511094 / Alexion Pharmaceuticals, Inc. | 2.14 | -18.31 | 334.06 | 11.53 | 0.9798 | -0.0483 | |||
| CRM / Salesforce, Inc. | 1.48 | -30.18 | 329.69 | -38.21 | 0.9670 | -0.8645 | |||
| BRK.A / Berkshire Hathaway Inc. | 0.00 | -0.22 | 316.80 | 7.61 | 0.9291 | -0.0813 | |||
| DIS / The Walt Disney Company | 1.63 | 6.61 | 295.09 | 55.67 | 0.8655 | 0.2148 | |||
| SIVB / SVB Financial Group | 0.72 | -3.15 | 276.65 | 54.38 | 0.8114 | 0.1963 | |||
| CI / The Cigna Group | 1.34 | 35.36 | 273.59 | 63.03 | 0.8024 | 0.2264 | |||
| CNC / Centene Corporation | 4.53 | -4.32 | 266.85 | -3.35 | 0.7827 | -0.1650 | |||
| BRK.B / Berkshire Hathaway Inc. | 1.15 | -0.17 | 263.28 | 7.67 | 0.7722 | -0.0671 | |||
| ANET / Arista Networks Inc | 0.89 | -4.97 | 258.28 | 32.71 | 0.7575 | 0.0895 | |||
| FFIV / F5, Inc. | 1.40 | 29.24 | 245.89 | 84.92 | 0.7212 | 0.2648 | |||
| ANSS / ANSYS, Inc. | 0.64 | 1.97 | 232.96 | 12.90 | 0.6832 | -0.0250 | |||
| ECL / Ecolab Inc. | 1.08 | 5.07 | 231.92 | 13.16 | 0.6802 | -0.0232 | |||
| CDNS / Cadence Design Systems, Inc. | 1.64 | 12.17 | 222.09 | 42.28 | 0.6514 | 0.1156 | |||
| DHR / Danaher Corporation | 1.00 | -13.87 | 219.81 | -11.73 | 0.6447 | -0.2100 | |||
| CBRE / CBRE Group, Inc. | 3.50 | -8.02 | 218.43 | 22.19 | 0.6406 | 0.0271 | |||
| TGT / Target Corporation | 1.25 | -8.20 | 217.09 | 1.40 | 0.6367 | -0.0981 | |||
| FIS / Fidelity National Information Services, Inc. | 1.51 | 63.53 | 211.27 | 55.00 | 0.6196 | 0.1518 | |||
| EQIX / Equinix, Inc. | 0.30 | 80.42 | 210.50 | 66.25 | 0.6174 | 0.1828 | |||
| HD / The Home Depot, Inc. | 0.78 | -0.75 | 208.19 | -5.20 | 0.6106 | -0.1432 | |||
| NFLX / Netflix, Inc. | 0.38 | -22.52 | 201.66 | -18.72 | 0.5915 | -0.2601 | |||
| CL / Colgate-Palmolive Company | 2.37 | 9.11 | 201.15 | 19.83 | 0.5900 | 0.0138 | |||
| PG / The Procter & Gamble Company | 1.44 | 45.11 | 198.76 | 43.84 | 0.5830 | 0.1087 | |||
| TTWO / Take-Two Interactive Software, Inc. | 0.95 | 5.23 | 196.47 | 31.43 | 0.5762 | 0.0631 | |||
| EA / Electronic Arts Inc. | 1.33 | 10.20 | 189.18 | 20.04 | 0.5549 | 0.0139 | |||
| VZ / Verizon Communications Inc. | 3.22 | 5.32 | 187.19 | 2.93 | 0.5490 | -0.0752 | |||
| INTC / Intel Corporation | 3.83 | -27.30 | 186.77 | -31.55 | 0.5478 | -0.3888 | |||
| ACN / Accenture plc | 0.72 | 29.11 | 186.54 | 47.13 | 0.5471 | 0.1119 | |||
| IBM / International Business Machines Corporation | 1.49 | -4.84 | 185.05 | -2.75 | 0.5427 | -0.1104 | |||
| C / Citigroup Inc. | 3.03 | 4.05 | 184.68 | 46.89 | 0.5417 | 0.1101 | |||
| GS / The Goldman Sachs Group, Inc. | 0.71 | 22.27 | 183.18 | 57.85 | 0.5372 | 0.1389 | |||
| MRVL / Marvell Technology, Inc. | 3.74 | 11.13 | 177.69 | 32.97 | 0.5211 | 0.0625 | |||
| DG / Dollar General Corporation | 0.80 | 167.72 | 0.4919 | 0.4919 | |||||
| SBUX / Starbucks Corporation | 1.56 | 1.30 | 165.15 | 24.94 | 0.4844 | 0.0307 | |||
| PFE / Pfizer Inc. | 4.33 | 15.04 | 158.93 | 15.16 | 0.4661 | -0.0076 | |||
| NSC / Norfolk Southern Corporation | 0.66 | 0.79 | 156.37 | 11.14 | 0.4586 | -0.0243 | |||
| POOL / Pool Corporation | 0.42 | 18.30 | 155.98 | 29.88 | 0.4575 | 0.0453 | |||
| YNDX / Yandex N.V. | 0.96 | 153.76 | 0.4510 | 0.1223 | |||||
| TT / Trane Technologies plc | 1.04 | -2.75 | 151.27 | 16.16 | 0.4437 | -0.0033 | |||
| PEP / PepsiCo, Inc. | 1.03 | 0.31 | 151.25 | 6.61 | 0.4436 | -0.0433 | |||
| GILD / Gilead Sciences, Inc. | 2.64 | -4.37 | 149.72 | -14.27 | 0.4391 | -0.1603 | |||
| DLR / Digital Realty Trust, Inc. | 1.08 | -0.92 | 149.34 | -6.60 | 0.4380 | -0.1108 | |||
| RHI / Robert Half Inc. | 2.40 | -9.19 | 149.00 | 6.52 | 0.4370 | -0.0431 | |||
| BAC / Bank of America Corporation | 4.88 | 1.93 | 146.25 | 26.86 | 0.4289 | 0.0332 | |||
| VEEV / Veeva Systems Inc. | 0.53 | 145.08 | 0.4255 | 0.4255 | |||||
| BBY / Best Buy Co., Inc. | 1.43 | -8.43 | 144.51 | -16.58 | 0.4238 | -0.1707 | |||
| FTCH / Farfetch Limited | 2.19 | 141.47 | 0.4149 | 0.4149 | |||||
| ON / ON Semiconductor Corporation | 4.35 | 141.36 | 0.4146 | 0.4146 | |||||
| EW / Edwards Lifesciences Corporation | 1.52 | 12.09 | 135.81 | 25.88 | 0.3983 | 0.0280 | |||
| ROK / Rockwell Automation, Inc. | 0.54 | 0.32 | 135.21 | 13.24 | 0.3966 | -0.0133 | |||
| TSLA / Tesla, Inc. | 0.19 | 133.61 | 0.3919 | 0.3919 | |||||
| MSCI / MSCI Inc. | 0.30 | 133.17 | 0.3906 | 0.3906 | |||||
| ENPH / Enphase Energy, Inc. | 0.75 | -56.68 | 129.41 | -9.29 | 0.3795 | 0.3795 | |||
| 00B58JVZ5 / Seagate Technology PLC Bond | 2.10 | -11.43 | 127.17 | 8.94 | 0.3730 | -0.0277 | |||
| AMT / American Tower Corporation | 0.58 | 32.65 | 126.87 | 20.91 | 0.3721 | 0.0119 | |||
| BABA / Alibaba Group Holding Limited - Depositary Receipt (Common Stock) | 0.52 | 12.68 | 124.96 | -8.63 | 0.3665 | -0.1029 | |||
| LLY / Eli Lilly and Company | 0.75 | 29.44 | 124.91 | 46.04 | 0.3664 | 0.0728 | |||
| ETN / Eaton Corporation plc | 1.04 | 124.05 | 0.3638 | 0.3638 | |||||
| CAH / Cardinal Health, Inc. | 2.23 | -11.20 | 119.13 | 1.17 | 0.3494 | -0.0548 | |||
| SYY / Sysco Corporation | 1.62 | 118.84 | 0.3485 | 0.3485 | |||||
| AXP / American Express Company | 0.99 | 1.47 | 118.32 | 20.88 | 0.3470 | 0.0111 | |||
| AMGN / Amgen Inc. | 0.52 | 6.78 | 118.06 | -4.56 | 0.3462 | -0.0783 | |||
| COO / The Cooper Companies, Inc. | 0.33 | 4.36 | 116.09 | 10.35 | 0.3405 | -0.0206 | |||
| SNAP / Snap Inc. | 2.34 | 115.67 | 0.3393 | 0.3393 | |||||
| JNJ / Johnson & Johnson | 0.72 | 3.61 | 113.03 | 8.60 | 0.3315 | -0.0257 | |||
| C.WSA / Citigroup, Inc. | 0.16 | 112.86 | 0.3310 | 0.3310 | |||||
| BMY / Bristol-Myers Squibb Company | 1.79 | 1.60 | 110.97 | 4.34 | 0.3255 | -0.0396 | |||
| ORCL / Oracle Corporation | 1.69 | 108.96 | 0.3196 | 0.3196 | |||||
| KLAC / KLA Corporation | 0.41 | -19.77 | 107.83 | 7.73 | 0.3163 | -0.0273 | |||
| VFC / V.F. Corporation | 1.22 | 23.50 | 105.27 | 51.45 | 0.3087 | 0.0702 | |||
| EXC / Exelon Corporation | 2.51 | 1.73 | 105.21 | 19.29 | 0.3086 | 0.0058 | |||
| HSIC / Henry Schein, Inc. | 1.59 | 104.37 | 0.3061 | 0.3061 | |||||
| MCK / McKesson Corporation | 0.60 | -10.42 | 104.06 | 4.31 | 0.3052 | -0.0372 | |||
| 00B783TY6 / Delphi Automotive Plc Bond | 0.80 | 104.00 | 0.3050 | 0.3050 | |||||
| UCTT / Ultra Clean Holdings, Inc. | 3.30 | 103.98 | 0.3050 | 0.3050 | |||||
| JLL / Jones Lang LaSalle Incorporated | 0.70 | -5.29 | 103.78 | 47.75 | 0.3044 | 0.0633 | |||
| VRTX / Vertex Pharmaceuticals Incorporated | 0.44 | 101.67 | 0.2982 | 0.2982 | |||||
| YNDX / Yandex N.V. | 1.45 | 89.21 | 100.90 | 5.36 | 0.2959 | -0.0328 | |||
| FRC / First Republic Bank | 0.69 | 43.19 | 99.78 | 90.13 | 0.2926 | 0.1125 | |||
| THO / THOR Industries, Inc. | 1.00 | 0.00 | 96.92 | 1.74 | 0.2843 | -0.0427 | |||
| INVH / Invitation Homes Inc. | 3.24 | -2.82 | 95.55 | 2.53 | 0.2802 | -0.0396 | |||
| AON / Aon plc | 0.46 | 95.50 | 0.2801 | 0.2801 | |||||
| CIEN / Ciena Corporation | 1.80 | -40.00 | 94.48 | -20.65 | 0.2771 | -0.1316 | |||
| IFF / International Flavors & Fragrances Inc. | 0.80 | 78.42 | 88.78 | 62.11 | 0.2604 | 0.0724 | |||
| ODFL / Old Dominion Freight Line, Inc. | 0.45 | -0.14 | 87.37 | 6.87 | 0.2563 | -0.0244 | |||
| CYBR / CyberArk Software Ltd. | 0.53 | 12.54 | 85.19 | 75.19 | 0.2498 | 0.0829 | |||
| SSNC / SS&C Technologies Holdings, Inc. | 1.11 | 9.40 | 80.87 | 31.16 | 0.2372 | 0.0256 | |||
| ILMN / Illumina, Inc. | 0.22 | -64.95 | 79.17 | -58.71 | 0.2322 | -0.4260 | |||
| BKNG / Booking Holdings Inc. | 0.03 | -35.24 | 65.24 | -16.52 | 0.1913 | -0.0769 | |||
| ETSY / Etsy, Inc. | 0.32 | -35.28 | 59.27 | -2.54 | 0.1738 | -0.0349 | |||
| INTU / Intuit Inc. | 0.13 | 1.54 | 48.55 | 16.90 | 0.1424 | -0.0002 | |||
| COST / Costco Wholesale Corporation | 0.13 | -84.60 | 47.53 | -83.75 | 0.1394 | -0.8647 | |||
| SPOT / Spotify Technology S.A. | 0.13 | -55.78 | 41.52 | -41.78 | 0.1218 | -0.1230 | |||
| UNP / Union Pacific Corporation | 0.19 | -1.78 | 39.02 | 2.77 | 0.1145 | -0.0159 | |||
| HRB / H&R Block, Inc. | 2.32 | -20.01 | 36.02 | -23.84 | 0.1056 | -0.0567 | |||
| US75606N1090 / RealPage Inc | 0.38 | -50.18 | 33.30 | -24.71 | 0.0977 | -0.0541 | |||
| UBER / Uber Technologies, Inc. | 0.57 | -83.57 | 30.34 | -76.06 | 0.0890 | -0.3459 | |||
| ICE / Intercontinental Exchange, Inc. | 0.14 | -9.81 | 15.52 | 2.00 | 0.0455 | -0.0067 | |||
| WIX / Wix.com Ltd. | 0.06 | -63.04 | 15.33 | -62.74 | 0.0450 | -0.0962 | |||
| PTC / PTC Inc. | 0.01 | 39.25 | 1.14 | 101.23 | 0.0034 | 0.0014 | |||
| TTD / The Trade Desk, Inc. | 0.00 | -98.76 | 1.03 | -98.05 | 0.0030 | -0.1789 | |||
| CTSH / Cognizant Technology Solutions Corporation | 0.00 | -100.00 | 0.00 | -100.00 | -0.1134 | ||||
| KSS / Kohl's Corporation | 0.00 | -100.00 | 0.00 | -100.00 | -0.0609 | ||||
| APO / Apollo Global Management, Inc. | 0.00 | -100.00 | 0.00 | -100.00 | -0.0106 | ||||
| BX / Blackstone Inc. | 0.00 | -100.00 | 0.00 | -100.00 | -0.0206 | ||||
| GRUB / Just Eat Takeaway.com N.V. - ADR (New) | 0.00 | -100.00 | 0.00 | -100.00 | -0.0004 | ||||
| ROP / Roper Technologies, Inc. | 0.00 | -100.00 | 0.00 | -100.00 | -0.2471 | ||||
| PXD / Pioneer Natural Resources Company | 0.00 | -100.00 | 0.00 | -100.00 | -0.0162 | ||||
| AON / Aon plc | 0.00 | -100.00 | 0.00 | -100.00 | -0.4450 | ||||
| WELL / Welltower Inc. | 0.00 | -100.00 | 0.00 | -100.00 | -0.0856 | ||||
| IR / Ingersoll Rand Inc. | 0.00 | 0.00 | 0.0000 | 0.0000 |