Basic Stats
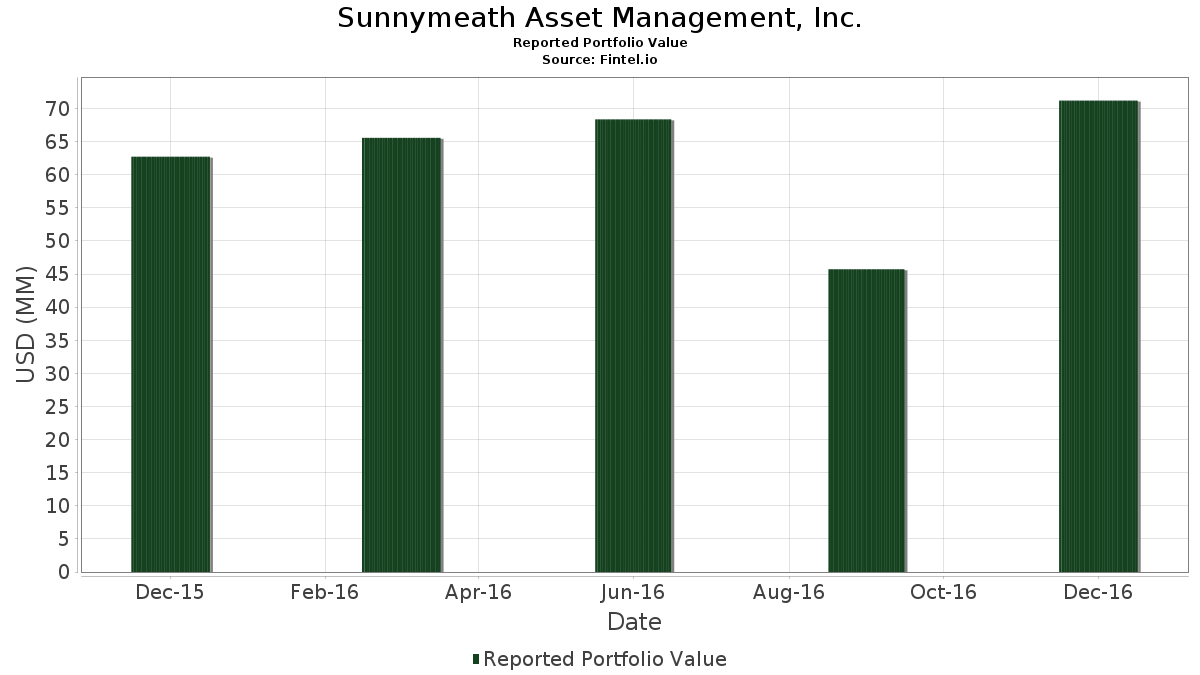
| Portfolio Value | $ 71,193,000 |
| Current Positions | 144 |
Latest Holdings, Performance, AUM (from 13F, 13D)
Sunnymeath Asset Management, Inc. has disclosed 144 total holdings in their latest SEC filings. Most recent portfolio value is calculated to be $ 71,193,000 USD. Actual Assets Under Management (AUM) is this value plus cash (which is not disclosed). Sunnymeath Asset Management, Inc.’s top holdings are Apple Inc. (US:AAPL) , Chevron Corporation (US:CVX) , AT&T Inc. (US:T) , The PNC Financial Services Group, Inc. (US:PNC) , and Solidion Technology, Inc. (US:STI) . Sunnymeath Asset Management, Inc.’s new positions include CSRA Inc. (US:CSRA) , Hanesbrands Inc. (US:HBI) , Modine Manufacturing Company (US:MOD) , SPDR S&P 500 ETF (US:SPY) , and SAExploration Holdings, Inc. (US:SAEXW) .
Top Increases This Quarter
We use the change in the portfolio allocation because this is the most meaningful metric. Changes can be due to trades or changes in share prices.
| Security | Shares (MM) |
Value (MM$) |
Portfolio % | ΔPortfolio % |
|---|---|---|---|---|
| 0.02 | 1.71 | 2.4019 | 2.4019 | |
| 0.03 | 1.64 | 2.3036 | 2.3036 | |
| 0.04 | 1.60 | 2.2502 | 2.2502 | |
| 0.02 | 1.86 | 2.6168 | 2.2210 | |
| 0.02 | 1.45 | 2.0311 | 2.0311 | |
| 0.03 | 1.42 | 1.9974 | 1.9974 | |
| 0.10 | 1.25 | 1.7600 | 1.7600 | |
| 0.02 | 1.23 | 1.7333 | 1.7333 | |
| 0.04 | 1.23 | 1.7263 | 1.7263 | |
| 0.03 | 1.22 | 1.7122 | 1.7122 |
Top Decreases This Quarter
We use the change in the portfolio allocation because this is the most meaningful metric. Changes can be due to trades or changes in share prices.
| Security | Shares (MM) |
Value (MM$) |
Portfolio % | ΔPortfolio % |
|---|---|---|---|---|
| 0.00 | 0.05 | 0.0744 | -2.1235 | |
| 0.00 | 0.00 | -1.8284 | ||
| 0.01 | 0.94 | 1.3133 | -0.6353 | |
| 0.02 | 1.32 | 1.8541 | -0.6347 | |
| 0.00 | 0.00 | -0.5555 | ||
| 0.01 | 0.74 | 1.0436 | -0.4895 | |
| 0.02 | 0.87 | 1.2220 | -0.4314 | |
| 0.02 | 1.66 | 2.3261 | -0.3815 | |
| 0.00 | 1.56 | 2.1954 | -0.3568 | |
| 0.03 | 0.87 | 1.2262 | -0.3506 |
13F and Fund Filings
This form was filed on 2017-01-13 for the reporting period 2016-12-31. Click the link icon to see the full transaction history.
Upgrade to unlock premium data and export to Excel ![]() .
.
| Security | Type | Avg Share Price | Shares (MM) |
ΔShares (%) |
ΔShares (%) |
Value ($MM) |
Portfolio (%) |
ΔPortfolio (%) |
|
|---|---|---|---|---|---|---|---|---|---|
| AAPL / Apple Inc. | 0.02 | 14.01 | 2.08 | 57.08 | 2.9146 | 0.0255 | |||
| CVX / Chevron Corporation | 0.02 | 6.32 | 1.98 | 63.13 | 2.7840 | 0.1267 | |||
| T / AT&T Inc. | 0.04 | 53.41 | 1.87 | 141.60 | 2.6267 | 0.9339 | |||
| PNC / The PNC Financial Services Group, Inc. | 0.02 | 222.67 | 1.86 | 929.28 | 2.6168 | 2.2210 | |||
| STI / Solidion Technology, Inc. | 0.03 | -3.09 | 1.72 | 55.71 | 2.4146 | 0.0001 | |||
| STT / State Street Corporation | 0.02 | 2,100.00 | 1.71 | 2,092.31 | 2.4019 | 2.4019 | |||
| CELG / Celgene Corp. | 0.01 | 5.91 | 1.66 | 160.03 | 2.3303 | 0.9350 | |||
| XOM / Exxon Mobil Corporation | 0.02 | 2.61 | 1.66 | 33.76 | 2.3261 | -0.3815 | |||
| OSK / Oshkosh Corporation | 0.03 | 7.19 | 1.64 | 60.00 | 2.3036 | 2.3036 | |||
| TSRA / Tessera Technologies, Inc. | 0.04 | 7.74 | 1.60 | 54.19 | 2.2502 | 2.2502 | |||
| GOOGL / Alphabet Inc. | 0.00 | 13.23 | 1.56 | 33.93 | 2.1954 | -0.3568 | |||
| BK / The Bank of New York Mellon Corporation | 0.03 | 3.25 | 1.51 | 60.15 | 2.1168 | 0.0588 | |||
| JBSS / John B. Sanfilippo & Son, Inc. | 0.02 | 22.69 | 1.45 | 118.76 | 2.0311 | 2.0311 | |||
| DKS / DICK'S Sporting Goods, Inc. | 0.03 | 15.02 | 1.42 | 43.20 | 1.9974 | 1.9974 | |||
| TWX / Warner Media LLC | 0.01 | 16.06 | 1.40 | 103.65 | 1.9595 | 0.4613 | |||
| RDS.A / Shell Plc - ADR (Representing Ordinary Shares - Class A) | 0.03 | 113.46 | 1.39 | 159.74 | 1.9482 | 0.7803 | |||
| PFE / Pfizer Inc. | 0.04 | 8.08 | 1.35 | 40.94 | 1.9005 | -0.1991 | |||
| MSFT / Microsoft Corporation | 0.02 | 431.45 | 1.34 | 464.71 | 1.8878 | 1.3673 | |||
| US0325111070 / Anadarko Petroleum Corp. | 0.02 | 2.16 | 1.32 | 15.99 | 1.8541 | -0.6347 | |||
| GPK / Graphic Packaging Holding Company | 0.10 | 61.60 | 1.25 | 106.43 | 1.7600 | 1.7600 | |||
| PF / Pinnacle Foods, Inc. | 0.02 | 0.00 | 1.23 | 1.7333 | 1.7333 | ||||
| PLOW / Douglas Dynamics, Inc. | 0.04 | 34.19 | 1.23 | 149.80 | 1.7263 | 1.7263 | |||
| GNRC / Generac Holdings Inc. | 0.03 | 16.80 | 1.22 | 52.57 | 1.7122 | 1.7122 | |||
| CSRA / CSRA Inc. | 0.03 | 1.06 | 1.4847 | 1.4847 | |||||
| TACO / Berto Acquisition Corp. | 0.07 | 12.42 | 1.05 | 83.25 | 1.4749 | 1.4749 | |||
| RSG / Republic Services, Inc. | 0.02 | 15.05 | 1.05 | 65.93 | 1.4707 | 0.0906 | |||
| EVTC / EVERTEC, Inc. | 0.06 | 0.00 | 0.98 | 1.3793 | 1.3793 | ||||
| LFUS / Littelfuse, Inc. | 0.01 | 13.16 | 0.98 | 38.22 | 1.3765 | 1.3765 | |||
| AEM / Agnico Eagle Mines Limited | 0.02 | -13.38 | 0.98 | -13.13 | 1.3751 | 1.3751 | |||
| CASY / Casey's General Stores, Inc. | 0.01 | -1.81 | 0.97 | 24.07 | 1.3611 | 1.3611 | |||
| RDS.B / Shell Plc - ADR | 0.01 | 1,112.50 | 0.95 | 1,414.29 | 1.3400 | 1.3400 | |||
| TFX / Teleflex Incorporated | 0.01 | -8.66 | 0.94 | 4.94 | 1.3133 | -0.6353 | |||
| ELY / Topgolf Callaway Brands Corp | 0.08 | 1.20 | 0.93 | 14.34 | 1.2993 | 1.2993 | |||
| SEE / Sealed Air Corporation | 0.02 | 20.77 | 0.92 | 54.87 | 1.2965 | -0.0070 | |||
| BSX / Boston Scientific Corporation | 0.04 | 10.57 | 0.91 | 33.48 | 1.2712 | -0.2116 | |||
| COST / Costco Wholesale Corporation | 0.01 | 16.75 | 0.89 | 67.42 | 1.2557 | 0.0879 | |||
| HD / The Home Depot, Inc. | 0.01 | 244.29 | 0.89 | 98.22 | 1.2529 | 0.2688 | |||
| MAS / Masco Corporation | 0.03 | -6.76 | 0.87 | 21.08 | 1.2262 | -0.3506 | |||
| PYPL / PayPal Holdings, Inc. | 0.02 | -13.73 | 0.87 | 15.08 | 1.2220 | -0.4314 | |||
| LUV / Southwest Airlines Co. | 0.02 | 0.00 | 0.83 | 41.85 | 1.1616 | -0.1134 | |||
| TRMB / Trimble Inc. | 0.03 | -1.80 | 0.82 | 31.05 | 1.1560 | -0.2174 | |||
| DLX / Deluxe Corporation | 0.01 | -18.57 | 0.82 | 22.16 | 1.1462 | 1.1462 | |||
| AXP / American Express Company | 0.01 | 34.15 | 0.81 | 205.24 | 1.1448 | 0.5608 | |||
| BP / BP p.l.c. - Depositary Receipt (Common Stock) | 0.02 | 60.97 | 0.80 | 164.69 | 1.1265 | 0.4638 | |||
| DIS / The Walt Disney Company | 0.01 | -3.75 | 0.80 | 43.21 | 1.1265 | -0.0982 | |||
| TMO / Thermo Fisher Scientific Inc. | 0.01 | -2.00 | 0.76 | 25.95 | 1.0703 | -0.2528 | |||
| LOW / Lowe's Companies, Inc. | 0.01 | -11.81 | 0.74 | 5.99 | 1.0436 | -0.4895 | |||
| PEP / PepsiCo, Inc. | 0.01 | 83.22 | 0.74 | 169.34 | 1.0366 | 0.4374 | |||
| HCA / HCA Healthcare, Inc. | 0.04 | 333.79 | 0.69 | 22.57 | 0.9762 | -0.2638 | |||
| APA / APA Corporation | 0.01 | 17.44 | 0.64 | 67.62 | 0.9018 | 0.0641 | |||
| VZ / Verizon Communications Inc. | 0.01 | 36.00 | 0.63 | 65.17 | 0.8793 | 0.0504 | |||
| URI / United Rentals, Inc. | 0.01 | 0.00 | 0.59 | 34.32 | 0.8301 | -0.1322 | |||
| HBI / Hanesbrands Inc. | 0.03 | 0.56 | 0.7866 | 0.7866 | |||||
| BMY / Bristol-Myers Squibb Company | 0.01 | -10.58 | 0.54 | 24.26 | 0.7627 | -0.1930 | |||
| MOD / Modine Manufacturing Company | 0.04 | 0.54 | 0.7557 | 0.7557 | |||||
| AVNT / Avient Corporation | 0.02 | 2.56 | 0.51 | -0.77 | 0.7206 | 0.7206 | |||
| JPM / JPMorgan Chase & Co. | 0.01 | 113.21 | 0.49 | 149.74 | 0.6841 | 0.2576 | |||
| PWR / Quanta Services, Inc. | 0.01 | -3.29 | 0.46 | 24.26 | 0.6475 | -0.1639 | |||
| SIMA / SIM Acquisition Corp. I | 0.02 | -3.59 | 0.43 | 16.35 | 0.5998 | 0.5998 | |||
| HCCI / Heritage-Crystal Clean Inc | 0.00 | -91.62 | 0.42 | 11.83 | 0.5843 | 0.5843 | |||
| DOW / Dow Inc. | 0.01 | 33.73 | 0.41 | 84.62 | 0.5731 | 0.0898 | |||
| SPY / SPDR S&P 500 ETF | 0.00 | 0.39 | 0.5492 | 0.5492 | |||||
| CVA / Covanta Holding Corporation | 0.02 | 0.00 | 0.38 | 0.5366 | 0.5366 | ||||
| DFS.PRB / Discover Financial Services, 6.50% Preferred Stock B | 0.01 | 0.00 | 0.32 | 0.4509 | 0.4509 | ||||
| NEM / Newmont Corporation | 0.01 | 45.38 | 0.30 | 153.39 | 0.4200 | 0.1619 | |||
| ANDV / Andeavor Corp. | 0.00 | 0.00 | 0.30 | 24.27 | 0.4172 | -0.1055 | |||
| EXP / Eagle Materials Inc. | 0.00 | -42.53 | 0.25 | -13.99 | 0.3455 | 0.3455 | |||
| WAB / Westinghouse Air Brake Technologies Corporation | 0.00 | 107.14 | 0.24 | 127.36 | 0.3385 | 0.1067 | |||
| VIAB / Viacom, Inc. | 0.01 | 404.58 | 0.23 | 439.53 | 0.3259 | 0.2318 | |||
| BIG / Big Lots, Inc. | 0.00 | -32.06 | 0.22 | -8.94 | 0.3146 | 0.3146 | |||
| LAMR / Lamar Advertising Company | 0.00 | 0.00 | 0.20 | 0.2739 | 0.2739 | ||||
| ARMK / Aramark | 0.01 | -64.08 | 0.18 | -39.93 | 0.2556 | 0.2556 | |||
| GE / General Electric Company | 0.01 | -32.21 | 0.17 | -19.35 | 0.2458 | -0.2288 | |||
| TACOW / Berto Acquisition Corp. - Equity Warrant | 0.04 | 0.00 | 0.17 | 25.93 | 0.2388 | -0.0565 | |||
| HUM / Humana Inc. | 0.00 | 0.00 | 0.16 | 1.88 | 0.2290 | 0.2290 | |||
| BRK.B / Berkshire Hathaway Inc. | 0.00 | 0.00 | 0.15 | 13.24 | 0.2163 | -0.0811 | |||
| AIG / American International Group, Inc. | 0.00 | 0.00 | 0.15 | 1.38 | 0.2065 | -0.1106 | |||
| USB / U.S. Bancorp | 0.00 | 0.00 | 0.15 | 6.57 | 0.2051 | -0.0945 | |||
| WFC / Wells Fargo & Company | 0.00 | 0.00 | 0.13 | 6.61 | 0.1812 | -0.0834 | |||
| SAEXW / SAExploration Holdings, Inc. | 0.02 | 0.12 | 0.1742 | 0.1742 | |||||
| LLL / JX Luxventure Limited | 0.00 | 0.00 | 0.12 | 0.87 | 0.1629 | -0.0886 | |||
| RIO / Rio Tinto Group - Depositary Receipt (Common Stock) | 0.00 | 0.12 | 0.1615 | 0.1615 | |||||
| EEM / iShares, Inc. - iShares MSCI Emerging Markets ETF | 0.00 | 0.00 | 0.11 | 0.1517 | 0.1517 | ||||
| MRK / Merck & Co., Inc. | 0.00 | -62.37 | 0.11 | -28.19 | 0.1503 | -0.1756 | |||
| NVR / NVR, Inc. | 0.00 | 0.00 | 0.10 | 7.53 | 0.1405 | -0.0629 | |||
| MO / Altria Group, Inc. | 0.00 | 0.00 | 0.10 | 8.99 | 0.1362 | -0.0584 | |||
| CSX / CSX Corporation | 0.00 | 1.66 | 0.09 | 5.88 | 0.1264 | -0.0595 | |||
| ABC / Amerisource Bergen Corp. | 0.00 | -11.18 | 0.09 | -12.12 | 0.1222 | -0.0943 | |||
| TOL / Toll Brothers, Inc. | 0.00 | 10.64 | 0.08 | 36.67 | 0.1152 | 0.1152 | |||
| FCN / FTI Consulting, Inc. | 0.00 | -89.41 | 0.08 | -85.61 | 0.1082 | 0.1082 | |||
| ABM / ABM Industries Incorporated | 0.00 | 0.00 | 0.07 | 0.1039 | 0.1039 | ||||
| CNI / Canadian National Railway Company | 0.00 | 0.00 | 0.07 | 0.1039 | 0.1039 | ||||
| EMR / Emerson Electric Co. | 0.00 | 0.00 | 0.06 | 1.61 | 0.0885 | -0.0471 | |||
| GILD / Gilead Sciences, Inc. | 0.00 | 0.00 | 0.06 | -6.15 | 0.0857 | -0.0565 | |||
| CB / Chubb Limited | 0.00 | -96.08 | 0.05 | -94.73 | 0.0744 | -2.1235 | |||
| SU / Suncor Energy Inc. | 0.00 | 0.00 | 0.04 | 0.0632 | 0.0632 | ||||
| LLY / Eli Lilly and Company | 0.00 | -96.50 | 0.04 | -96.21 | 0.0618 | 0.0618 | |||
| MET / MetLife, Inc. | 0.00 | 0.00 | 0.04 | 0.0604 | 0.0604 | ||||
| GLW / Corning Incorporated | 0.00 | 0.00 | 0.04 | 2.38 | 0.0604 | -0.0315 | |||
| HCC / Warrior Met Coal, Inc. | 0.00 | 0.00 | 0.04 | 0.0590 | 0.0590 | ||||
| AEP / American Electric Power Company, Inc. | 0.00 | 1.33 | 0.04 | 5.00 | 0.0590 | -0.0285 | |||
| EXK / Endeavour Silver Corp. | 0.00 | 0.00 | 0.04 | 0.0590 | 0.0590 | ||||
| D / Dominion Energy, Inc. | 0.00 | 0.00 | 0.04 | 8.33 | 0.0548 | 0.0548 | |||
| KSS / Kohl's Corporation | 0.00 | 0.00 | 0.04 | 0.0534 | 0.0534 | ||||
| TFX / Teleflex Incorporated | Put | 0.00 | 0.00 | 0.04 | 8.82 | 0.0520 | -0.0224 | ||
| NRG / NRG Energy, Inc. | 0.00 | -88.46 | 0.04 | -74.66 | 0.0520 | 0.0520 | |||
| PSX / Phillips 66 | 0.00 | 0.00 | 0.04 | 2.94 | 0.0492 | -0.0252 | |||
| SF / Stifel Financial Corp. | 0.00 | 0.00 | 0.04 | 0.0492 | 0.0492 | ||||
| SLB / Schlumberger Limited | 0.00 | 0.00 | 0.03 | 6.25 | 0.0478 | -0.0222 | |||
| PEG / Public Service Enterprise Group Incorporated | 0.00 | 0.00 | 0.03 | 6.25 | 0.0478 | -0.0222 | |||
| LBRDA / Liberty Broadband Corporation | 0.00 | 0.00 | 0.03 | 10.00 | 0.0464 | -0.0193 | |||
| GSK / GSK plc - Depositary Receipt (Common Stock) | 0.00 | -96.65 | 0.03 | -95.83 | 0.0435 | 0.0435 | |||
| RXN / Rexnord Corp | 0.00 | -95.48 | 0.03 | -94.22 | 0.0407 | 0.0407 | |||
| HON / Honeywell International Inc. | 0.00 | 0.00 | 0.03 | 0.0393 | 0.0393 | ||||
| META / Meta Platforms, Inc. | 0.00 | 0.00 | 0.02 | 0.0323 | 0.0323 | ||||
| OXY / Occidental Petroleum Corporation | 0.00 | 0.00 | 0.02 | 4.55 | 0.0323 | -0.0158 | |||
| SHLD / Global X Funds - Global X Defense Tech ETF | Put | 0.00 | 0.02 | 0.0267 | 0.0267 | ||||
| MYJ / BlackRock MuniYield New Jersey Fund Inc | 0.00 | 0.00 | 0.02 | 0.0253 | 0.0253 | ||||
| PFF / iShares Trust - iShares Preferred and Income Securities ETF | 0.00 | 0.00 | 0.02 | 0.0239 | 0.0239 | ||||
| AFL / Aflac Incorporated | 0.00 | 0.00 | 0.01 | 0.0197 | 0.0197 | ||||
| GOOG / Alphabet Inc. | 0.00 | 0.01 | 0.0169 | 0.0169 | |||||
| OSK / Oshkosh Corporation | Put | 0.00 | 0.01 | 0.0169 | 0.0169 | ||||
| ALV / Autoliv, Inc. | 0.00 | 0.00 | 0.01 | 0.0155 | 0.0155 | ||||
| 61166W101 / Monsanto Co. | 0.00 | 0.00 | 0.01 | 0.0155 | 0.0155 | ||||
| VNQ / Vanguard Specialized Funds - Vanguard Real Estate ETF | 0.00 | 0.00 | 0.01 | 0.0126 | 0.0126 | ||||
| / BMC Stock Holdings, Inc. | Call | 0.00 | 0.01 | 0.0126 | 0.0126 | ||||
| EFA / iShares Trust - iShares MSCI EAFE ETF | 0.00 | 0.00 | 0.01 | 0.0112 | 0.0112 | ||||
| ALLY / Ally Financial Inc. | Call | 0.00 | 0.01 | 0.0112 | 0.0112 | ||||
| AN / AutoNation, Inc. | Call | 0.00 | 0.00 | 0.01 | 16.67 | 0.0098 | 0.0098 | ||
| XLB / The Select Sector SPDR Trust - The Materials Select Sector SPDR Fund | Put | 0.00 | 0.01 | 0.0070 | 0.0070 | ||||
| CASY / Casey's General Stores, Inc. | Put | 0.00 | 0.01 | 0.0070 | 0.0070 | ||||
| RIO / Rio Tinto Group - Depositary Receipt (Common Stock) | Call | 0.00 | 0.00 | 0.0056 | 0.0056 | ||||
| PEI / Pennsylvania Real Estate Investment Trust | Call | 0.00 | 0.00 | 0.00 | 300.00 | 0.0056 | 0.0034 | ||
| GM / General Motors Company | Call | 0.00 | 0.00 | 0.0056 | 0.0056 | ||||
| GNOG / Golden Nugget Online Gaming Inc - Class A | Call | 0.00 | 0.00 | 0.0042 | 0.0042 | ||||
| 887228104 / Time Inc. | 0.00 | 0.00 | 0.00 | 0.0042 | 0.0042 | ||||
| ARRS / ARRIS International plc | Call | 0.00 | 0.00 | 0.0042 | 0.0042 | ||||
| EXP / Eagle Materials Inc. | Put | 0.00 | 0.00 | 0.0028 | 0.0028 | ||||
| JPS / Nuveen Preferred & Income Securities Fund | 0.00 | 0.00 | 0.00 | 0.0028 | 0.0028 | ||||
| BWX / SPDR Series Trust - SPDR Bloomberg International Treasury Bond ETF | 0.00 | 0.00 | 0.00 | 0.0028 | 0.0028 | ||||
| PEI / Pennsylvania Real Estate Investment Trust | Call | 0.00 | 0.00 | 0.0014 | -0.0008 | ||||
| / Chase Packaging Corp. | 0.08 | 0.00 | 0.00 | 0.0014 | 0.0014 | ||||
| BLL / Ball Corp. | Call | 0.00 | 0.00 | 0.0014 | 0.0014 | ||||
| LOW / Lowe's Companies, Inc. | Put | 0.00 | 0.00 | 0.0014 | 0.0014 | ||||
| SLGN / Silgan Holdings Inc. | Call | 0.00 | -100.00 | 0.00 | -100.00 | 0.0000 | |||
| CAMP / Camp4 Therapeutics Corporation | Call | 0.00 | -100.00 | 0.00 | -100.00 | 0.0000 | |||
| HD / The Home Depot, Inc. | Put | 0.00 | 0.00 | 0.0000 | 0.0000 | ||||
| VAC / Marriott Vacations Worldwide Corporation | Call | 0.00 | -100.00 | 0.00 | -100.00 | 0.0000 | |||
| BIG / Big Lots, Inc. | Call | 0.00 | -100.00 | 0.00 | -100.00 | 0.0000 | |||
| FN / Fabrinet | 0.00 | -100.00 | 0.00 | -100.00 | 0.0000 | ||||
| / BMC Stock Holdings, Inc. | 0.00 | -100.00 | 0.00 | -100.00 | 0.0000 | ||||
| DIS / The Walt Disney Company | Put | 0.00 | -100.00 | 0.00 | -100.00 | -0.0109 | |||
| BELFB / Bel Fuse Inc. | 0.00 | -100.00 | 0.00 | -100.00 | 0.0000 | ||||
| BAC / Bank of America Corporation | 0.00 | -100.00 | 0.00 | -100.00 | -0.1006 | ||||
| CAT / Caterpillar Inc. | Call | 0.00 | -100.00 | 0.00 | -100.00 | -0.0765 | |||
| LEN / Lennar Corporation | 0.00 | -100.00 | 0.00 | -100.00 | -0.5555 | ||||
| HI / Hillenbrand, Inc. | Call | 0.00 | -100.00 | 0.00 | -100.00 | 0.0000 | |||
| ROST / Ross Stores, Inc. | 0.00 | -100.00 | 0.00 | -100.00 | -1.8284 | ||||
| DISCA / Discovery Inc - Class A | 0.00 | -100.00 | 0.00 | -100.00 | 0.0000 | ||||
| CELG / Celgene Corp. | Call | 0.00 | -100.00 | 0.00 | -100.00 | -0.0044 | |||
| DLX / Deluxe Corporation | Put | 0.00 | -100.00 | 0.00 | -100.00 | 0.0000 | |||
| GPS / The Gap, Inc. | Call | 0.00 | -100.00 | 0.00 | -100.00 | 0.0000 | |||
| Alphabet Inc Cap Stock Cl C / CL C (020796107) | 0.00 | -100.00 | 0.00 | -100.00 | 0.0000 | ||||
| WU / The Western Union Company | Put | 0.00 | -100.00 | 0.00 | -100.00 | -0.0131 |