Basic Stats
| Portfolio Value | $ 606,160,174 |
| Current Positions | 30 |
Latest Holdings, Performance, AUM (from 13F, 13D)
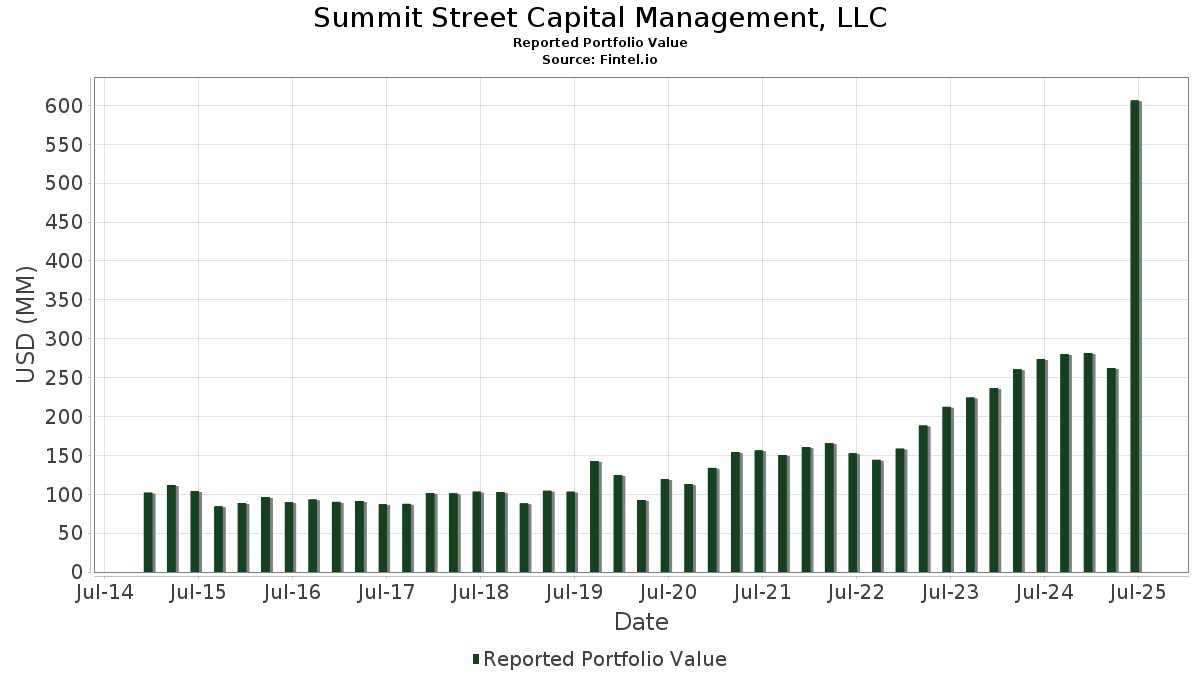
Summit Street Capital Management, LLC has disclosed 30 total holdings in their latest SEC filings. Most recent portfolio value is calculated to be $ 606,160,174 USD. Actual Assets Under Management (AUM) is this value plus cash (which is not disclosed). Summit Street Capital Management, LLC’s top holdings are Micron Technology, Inc. (US:MU) , Warner Bros. Discovery, Inc. (US:WBD) , KLA Corporation (US:KLAC) , Lam Research Corporation (US:LRCX) , and InterDigital, Inc. (US:IDCC) . Summit Street Capital Management, LLC’s new positions include Scorpio Tankers Inc. (US:STNG) , Teekay Tankers Ltd. (US:TNK) , .
Top Increases This Quarter
We use the change in the portfolio allocation because this is the most meaningful metric. Changes can be due to trades or changes in share prices.
| Security | Shares (MM) |
Value (MM$) |
Portfolio % | ΔPortfolio % |
|---|---|---|---|---|
| 0.50 | 19.51 | 3.2187 | 3.2187 | |
| 0.44 | 18.30 | 3.0191 | 3.0191 | |
| 0.26 | 31.70 | 5.2290 | 2.9907 | |
| 0.28 | 27.59 | 4.5513 | 0.9486 | |
| 0.03 | 29.20 | 4.8175 | 0.8731 | |
| 0.16 | 25.95 | 4.2804 | 0.8540 | |
| 0.06 | 25.81 | 4.2575 | 0.5656 | |
| 0.12 | 21.81 | 3.5988 | 0.4799 | |
| 0.28 | 26.19 | 4.3203 | 0.2556 | |
| 0.30 | 21.00 | 3.4637 | 0.0405 |
Top Decreases This Quarter
We use the change in the portfolio allocation because this is the most meaningful metric. Changes can be due to trades or changes in share prices.
| Security | Shares (MM) |
Value (MM$) |
Portfolio % | ΔPortfolio % |
|---|---|---|---|---|
| 0.00 | 0.00 | -17.6572 | ||
| 0.26 | 18.20 | 3.0027 | -1.1028 | |
| 0.01 | 15.40 | 2.5399 | -0.9825 | |
| 0.03 | 13.22 | 2.1806 | -0.7577 | |
| 0.08 | 19.84 | 3.2733 | -0.7322 | |
| 0.08 | 23.22 | 3.8310 | -0.7253 | |
| 0.07 | 19.78 | 3.2635 | -0.7017 | |
| 0.44 | 20.09 | 3.3148 | -0.7014 | |
| 0.37 | 15.05 | 2.4830 | -0.6314 | |
| 0.32 | 18.31 | 3.0203 | -0.6042 |
13F and Fund Filings
This form was filed on 2025-08-14 for the reporting period 2025-06-30. Click the link icon to see the full transaction history.
Upgrade to unlock premium data and export to Excel ![]() .
.
| Security | Type | Avg Share Price | Shares (MM) |
ΔShares (%) |
ΔShares (%) |
Value ($MM) |
Portfolio (%) |
ΔPortfolio (%) |
|
|---|---|---|---|---|---|---|---|---|---|
| MU / Micron Technology, Inc. | 0.26 | 66.22 | 31.70 | 135.77 | 5.2290 | 2.9907 | |||
| WBD / Warner Bros. Discovery, Inc. | 2.69 | -6.73 | 30.81 | -0.38 | 5.0825 | -0.0665 | |||
| KLAC / KLA Corporation | 0.03 | -6.45 | 29.20 | 23.26 | 4.8175 | 0.8731 | |||
| LRCX / Lam Research Corporation | 0.28 | -4.78 | 27.59 | 27.50 | 4.5513 | 0.9486 | |||
| IDCC / InterDigital, Inc. | 0.12 | -9.33 | 27.37 | -1.66 | 4.5159 | -0.1187 | |||
| CF / CF Industries Holdings, Inc. | 0.28 | -8.88 | 26.19 | 7.27 | 4.3203 | 0.2556 | |||
| MPC / Marathon Petroleum Corporation | 0.16 | 10.58 | 25.95 | 26.08 | 4.2804 | 0.8540 | |||
| DDS / Dillard's, Inc. | 0.06 | -0.25 | 25.81 | 16.38 | 4.2575 | 0.5656 | |||
| VLO / Valero Energy Corporation | 0.17 | -2.26 | 23.38 | -0.53 | 3.8577 | -0.0562 | |||
| UTHR / United Therapeutics Corporation | 0.08 | -8.97 | 23.22 | -15.14 | 3.8310 | -0.7253 | |||
| AMAT / Applied Materials, Inc. | 0.12 | -7.69 | 21.81 | 16.45 | 3.5988 | 0.4799 | |||
| CSCO / Cisco Systems, Inc. | 0.30 | -9.17 | 21.00 | 2.12 | 3.4637 | 0.0405 | |||
| FOXA / Fox Corporation | 0.37 | -4.19 | 20.51 | -5.13 | 3.3837 | -0.2160 | |||
| HCC / Warrior Met Coal, Inc. | 0.44 | -13.27 | 20.09 | -16.70 | 3.3148 | -0.7014 | |||
| HUM / Humana Inc. | 0.08 | -10.74 | 19.84 | -17.53 | 3.2733 | -0.7322 | |||
| MOH / Molina Healthcare, Inc. | 0.07 | -8.16 | 19.78 | -16.93 | 3.2635 | -0.7017 | |||
| STNG / Scorpio Tankers Inc. | 0.50 | 19.51 | 3.2187 | 3.2187 | |||||
| LB / LandBridge Company LLC | 0.29 | -8.13 | 19.31 | -13.70 | 3.1864 | -0.5397 | |||
| LYB / LyondellBasell Industries N.V. | 0.32 | 2.33 | 18.31 | -15.90 | 3.0203 | -0.6042 | |||
| TNK / Teekay Tankers Ltd. | 0.44 | 18.30 | 3.0191 | 3.0191 | |||||
| CNR / Core Natural Resources, Inc. | 0.26 | -18.40 | 18.20 | -26.19 | 3.0027 | -1.1028 | |||
| HPQ / HP Inc. | 0.72 | -4.88 | 17.68 | -15.97 | 2.9167 | -0.5864 | |||
| BKE / The Buckle, Inc. | 0.38 | -20.50 | 17.16 | -5.91 | 2.8306 | -0.2055 | |||
| INTC / Intel Corporation | 0.75 | -1.29 | 16.74 | -2.63 | 2.7618 | -0.1009 | |||
| TPL / Texas Pacific Land Corporation | 0.01 | -8.72 | 15.40 | -27.23 | 2.5399 | -0.9825 | |||
| DINO / HF Sinclair Corporation | 0.37 | -35.60 | 15.05 | -19.54 | 2.4830 | -0.6314 | |||
| ELV / Elevance Health, Inc. | 0.03 | -16.42 | 13.22 | -25.10 | 2.1806 | -0.7577 | |||
| KLIC / Kulicke and Soffa Industries, Inc. | 0.28 | -27.40 | 9.75 | -23.84 | 1.6086 | -0.5229 | |||
| GNTX / Gentex Corporation | 0.38 | -9.40 | 8.46 | -14.49 | 1.3954 | -0.2515 | |||
| MGA / Magna International Inc. | 0.12 | -13.27 | 4.82 | -1.47 | 0.7954 | -0.0194 | |||
| TNET / TriNet Group, Inc. | 0.00 | -100.00 | 0.00 | 0.0000 | |||||
| HUN / Huntsman Corporation | 0.00 | -100.00 | 0.00 | 0.0000 | |||||
| BRK.A / Berkshire Hathaway Inc. | 0.00 | -100.00 | 0.00 | -100.00 | -17.6572 |