Basic Stats
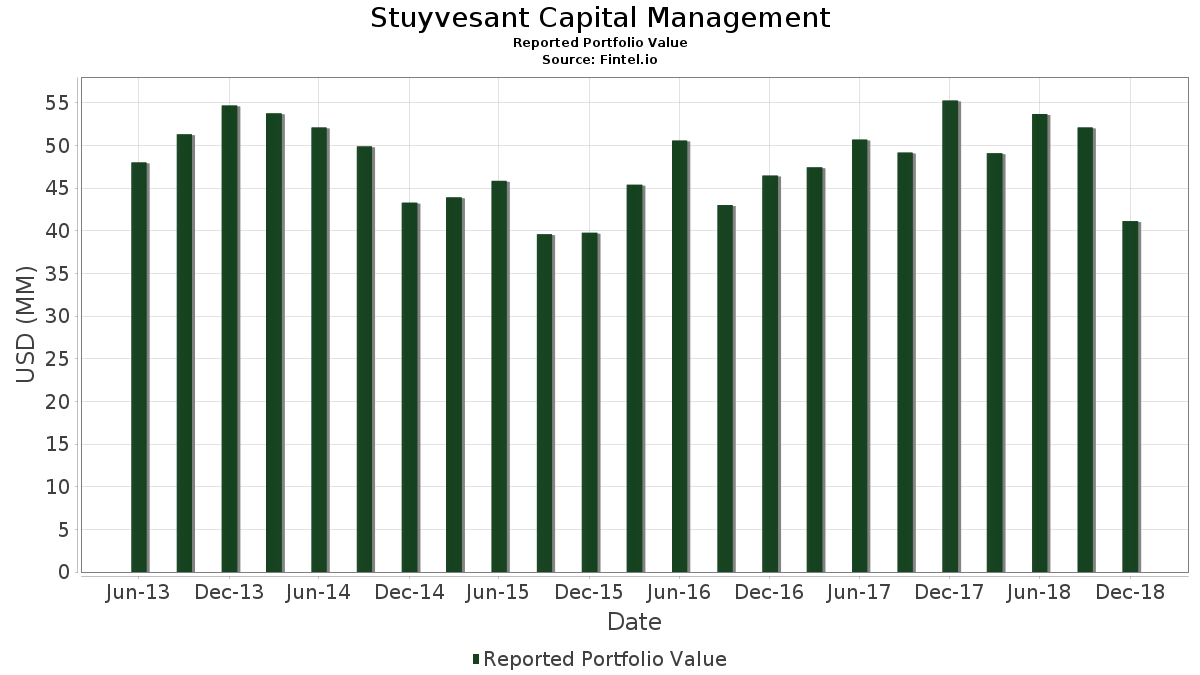
| Portfolio Value | $ 41,135,000 |
| Current Positions | 32 |
Latest Holdings, Performance, AUM (from 13F, 13D)
Stuyvesant Capital Management has disclosed 32 total holdings in their latest SEC filings. Most recent portfolio value is calculated to be $ 41,135,000 USD. Actual Assets Under Management (AUM) is this value plus cash (which is not disclosed). Stuyvesant Capital Management’s top holdings are Pfizer Inc. (US:PFE) , Viacom, Inc. (US:VIAB) , McEwen Inc. (US:MUX) , VanEck ETF Trust - VanEck Gold Miners ETF (US:GDX) , and Freeport-McMoRan Inc. (US:FCX) . Stuyvesant Capital Management’s new positions include Delta Air Lines, Inc. (US:DAL) , The Chemours Company (US:CC) , Las Vegas Sands Corp. (US:LVS) , .
Top Increases This Quarter
We use the change in the portfolio allocation because this is the most meaningful metric. Changes can be due to trades or changes in share prices.
| Security | Shares (MM) |
Value (MM$) |
Portfolio % | ΔPortfolio % |
|---|---|---|---|---|
| 0.11 | 2.82 | 6.8628 | 6.8628 | |
| 1.52 | 2.77 | 6.7242 | 6.7242 | |
| 0.13 | 2.68 | 6.5054 | 6.5054 | |
| 0.04 | 2.00 | 4.8693 | 4.8693 | |
| 0.04 | 1.79 | 4.3612 | 4.3612 | |
| 0.06 | 1.78 | 4.3175 | 4.3175 | |
| 0.03 | 1.73 | 4.1959 | 4.1959 | |
| 0.03 | 1.53 | 3.7146 | 3.2636 | |
| 0.13 | 1.23 | 2.9974 | 2.9974 | |
| 0.02 | 1.08 | 2.6328 | 2.6328 |
Top Decreases This Quarter
We use the change in the portfolio allocation because this is the most meaningful metric. Changes can be due to trades or changes in share prices.
| Security | Shares (MM) |
Value (MM$) |
Portfolio % | ΔPortfolio % |
|---|---|---|---|---|
| 0.07 | 3.26 | 7.9300 | -3.4641 | |
| 0.67 | 1.42 | 3.4423 | -2.6683 | |
| 0.04 | 1.16 | 2.8127 | -2.0927 | |
| 0.06 | 1.32 | 3.2162 | -1.8868 | |
| 0.04 | 1.65 | 4.0088 | -1.3035 | |
| 0.23 | 2.40 | 5.8442 | -0.9075 | |
| 0.17 | 1.30 | 3.1530 | -0.8926 | |
| 0.07 | 1.90 | 4.6092 | -0.8604 | |
| 0.13 | 0.24 | 0.5762 | -0.4736 | |
| 0.03 | 0.89 | 2.1709 | -0.1033 |
13F and Fund Filings
This form was filed on 2019-02-08 for the reporting period 2018-12-31. Click the link icon to see the full transaction history.
Upgrade to unlock premium data and export to Excel ![]() .
.
| Security | Type | Avg Share Price | Shares (MM) |
ΔShares (%) |
ΔShares (%) |
Value ($MM) |
Portfolio (%) |
ΔPortfolio (%) |
|
|---|---|---|---|---|---|---|---|---|---|
| PFE / Pfizer Inc. | 0.07 | -44.54 | 3.26 | -45.06 | 7.9300 | -3.4641 | |||
| VIAB / Viacom, Inc. | 0.11 | -10.26 | 2.82 | -31.70 | 6.8628 | 6.8628 | |||
| MUX / McEwen Inc. | 1.52 | -11.97 | 2.77 | -17.43 | 6.7242 | 6.7242 | |||
| GDX / VanEck ETF Trust - VanEck Gold Miners ETF | 0.13 | -6.16 | 2.68 | 6.87 | 6.5054 | 6.5054 | |||
| FCX / Freeport-McMoRan Inc. | 0.23 | -7.75 | 2.40 | -31.67 | 5.8442 | -0.9075 | |||
| C / Citigroup Inc. | 0.04 | -10.05 | 2.00 | -34.73 | 4.8693 | 4.8693 | |||
| SU / Suncor Energy Inc. | 0.07 | -7.99 | 1.90 | -33.47 | 4.6092 | -0.8604 | |||
| DAL / Delta Air Lines, Inc. | 0.04 | 1.79 | 4.3612 | 4.3612 | |||||
| CC / The Chemours Company | 0.06 | 1.78 | 4.3175 | 4.3175 | |||||
| LVS / Las Vegas Sands Corp. | 0.03 | 1.73 | 4.1959 | 4.1959 | |||||
| AIG / American International Group, Inc. | 0.04 | -19.53 | 1.65 | -40.43 | 4.0088 | -1.3035 | |||
| PCAR / PACCAR Inc | 0.03 | 675.36 | 1.53 | 550.21 | 3.7146 | 3.2636 | |||
| CHK / Chesapeake Energy Corporation | 0.67 | -4.91 | 1.42 | -55.53 | 3.4423 | -2.6683 | |||
| DVN / Devon Energy Corporation | 0.06 | -11.84 | 1.32 | -50.24 | 3.2162 | -1.8868 | |||
| GE / General Electric Company | 0.17 | -8.22 | 1.30 | -38.47 | 3.1530 | -0.8926 | |||
| GG / Goldcorp, Inc. | 0.13 | -15.33 | 1.23 | -18.61 | 2.9974 | 2.9974 | |||
| APA / APA Corporation | 0.04 | -17.82 | 1.16 | -54.73 | 2.8127 | -2.0927 | |||
| EWJ / iShares, Inc. - iShares MSCI Japan ETF | 0.02 | -2.84 | 1.08 | -18.20 | 2.6328 | 2.6328 | |||
| FXI / iShares Trust - iShares China Large-Cap ETF | 0.03 | -2.99 | 1.04 | -11.52 | 2.5404 | 0.2739 | |||
| NLY / Annaly Capital Management, Inc. | 0.10 | -12.76 | 0.97 | -16.20 | 2.3508 | 2.3508 | |||
| T / AT&T Inc. | 0.03 | -11.37 | 0.89 | -24.64 | 2.1709 | -0.1033 | |||
| ESV / Ensco plc | 0.24 | -8.83 | 0.87 | -61.54 | 2.1077 | 2.1077 | |||
| EWG / iShares, Inc. - iShares MSCI Germany ETF | 0.03 | -1.84 | 0.81 | -16.34 | 1.9667 | 1.9667 | |||
| EWZ / iShares, Inc. - iShares MSCI Brazil ETF | 0.02 | -5.16 | 0.74 | 7.43 | 1.7917 | 1.7917 | |||
| SAN / Banco Santander, S.A. - Depositary Receipt (Common Stock) | 0.13 | -2.35 | 0.58 | -12.46 | 1.4173 | 1.4173 | |||
| / Total S.A. | 0.01 | -1.31 | 0.49 | -20.13 | 1.1863 | 1.1863 | |||
| TRP / TC Energy Corporation | 0.01 | 0.00 | 0.26 | -11.78 | 0.6369 | 0.0669 | |||
| CXDC / China XD Plastics Co Ltd | 0.13 | -11.33 | 0.24 | -56.67 | 0.5762 | -0.4736 | |||
| VNM / VanEck ETF Trust - VanEck Vietnam ETF | 0.01 | 0.00 | 0.21 | -12.34 | 0.5008 | 0.5008 | |||
| CAAS / China Automotive Systems, Inc. | 0.03 | -2.15 | 0.08 | -33.06 | 0.2018 | -0.0362 | |||
| GREK / Global X Funds - Global X MSCI Greece ETF | 0.01 | -3.42 | 0.08 | -19.59 | 0.1896 | 0.1896 | |||
| SJT / San Juan Basin Royalty Trust | 0.01 | 0.00 | 0.07 | -4.23 | 0.1653 | 0.1653 | |||
| EWP / iShares, Inc. - iShares MSCI Spain ETF | 0.00 | -100.00 | 0.00 | -100.00 | 0.0000 |