Basic Stats
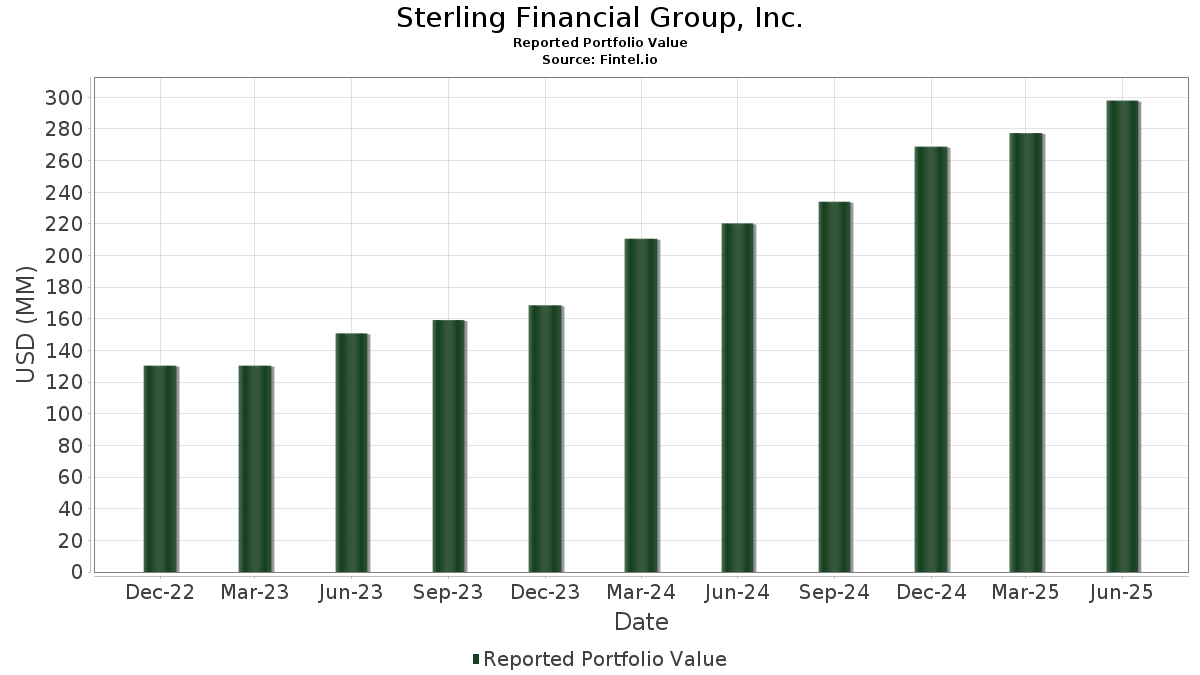
| Portfolio Value | $ 297,928,816 |
| Current Positions | 71 |
Latest Holdings, Performance, AUM (from 13F, 13D)
Sterling Financial Group, Inc. has disclosed 71 total holdings in their latest SEC filings. Most recent portfolio value is calculated to be $ 297,928,816 USD. Actual Assets Under Management (AUM) is this value plus cash (which is not disclosed). Sterling Financial Group, Inc.’s top holdings are Invesco Exchange-Traded Fund Trust - Invesco S&P 500 Quality ETF (US:SPHQ) , J.P. Morgan Exchange-Traded Fund Trust - JPMorgan Active Growth ETF (US:JGRO) , Amplify ETF Trust - Amplify CWP Enhanced Dividend Income ETF (US:DIVO) , iShares Trust - iShares iBonds 2026 Term High Yield and Income ETF (US:IBHF) , and iShares Trust - iShares International Equity Factor ETF (US:INTF) . Sterling Financial Group, Inc.’s new positions include Invesco Exchange-Traded Fund Trust - Invesco S&P 500 Quality ETF (US:SPHQ) , iShares Trust - iShares iBonds 2026 Term High Yield and Income ETF (US:IBHF) , iShares Bitcoin Trust ETF (US:IBIT) , Grayscale Ethereum Trust (US:ETHE) , and Invesco Exchange-Traded Fund Trust - Invesco S&P SmallCap Momentum ETF (US:XSMO) .
Top Increases This Quarter
We use the change in the portfolio allocation because this is the most meaningful metric. Changes can be due to trades or changes in share prices.
| Security | Shares (MM) |
Value (MM$) |
Portfolio % | ΔPortfolio % |
|---|---|---|---|---|
| 0.52 | 37.21 | 12.4901 | 12.4901 | |
| 1.21 | 28.13 | 9.4405 | 9.4405 | |
| 0.62 | 21.35 | 7.1664 | 2.1980 | |
| 0.35 | 30.51 | 10.2423 | 0.8795 | |
| 0.03 | 1.96 | 0.6590 | 0.6590 | |
| 0.02 | 2.47 | 0.8298 | 0.2350 | |
| 0.44 | 15.12 | 5.0751 | 0.1315 | |
| 0.01 | 0.29 | 0.0980 | 0.0980 | |
| 0.00 | 0.26 | 0.0882 | 0.0882 | |
| 0.00 | 0.23 | 0.0775 | 0.0775 |
Top Decreases This Quarter
We use the change in the portfolio allocation because this is the most meaningful metric. Changes can be due to trades or changes in share prices.
| Security | Shares (MM) |
Value (MM$) |
Portfolio % | ΔPortfolio % |
|---|---|---|---|---|
| 0.00 | 0.35 | 0.1179 | -13.8684 | |
| 0.05 | 10.88 | 3.6527 | -0.5913 | |
| 0.84 | 18.89 | 6.3417 | -0.3715 | |
| 0.00 | 1.46 | 0.4893 | -0.2732 | |
| 0.73 | 14.96 | 5.0216 | -0.2718 | |
| 0.60 | 12.30 | 4.1290 | -0.2016 | |
| 0.18 | 7.85 | 2.6340 | -0.1933 | |
| 0.02 | 5.21 | 1.7497 | -0.1260 | |
| 0.00 | 1.81 | 0.6067 | -0.1121 | |
| 0.11 | 2.69 | 0.9025 | -0.0898 |
13F and Fund Filings
This form was filed on 2025-07-10 for the reporting period 2025-06-30. Click the link icon to see the full transaction history.
Upgrade to unlock premium data and export to Excel ![]() .
.