Basic Stats
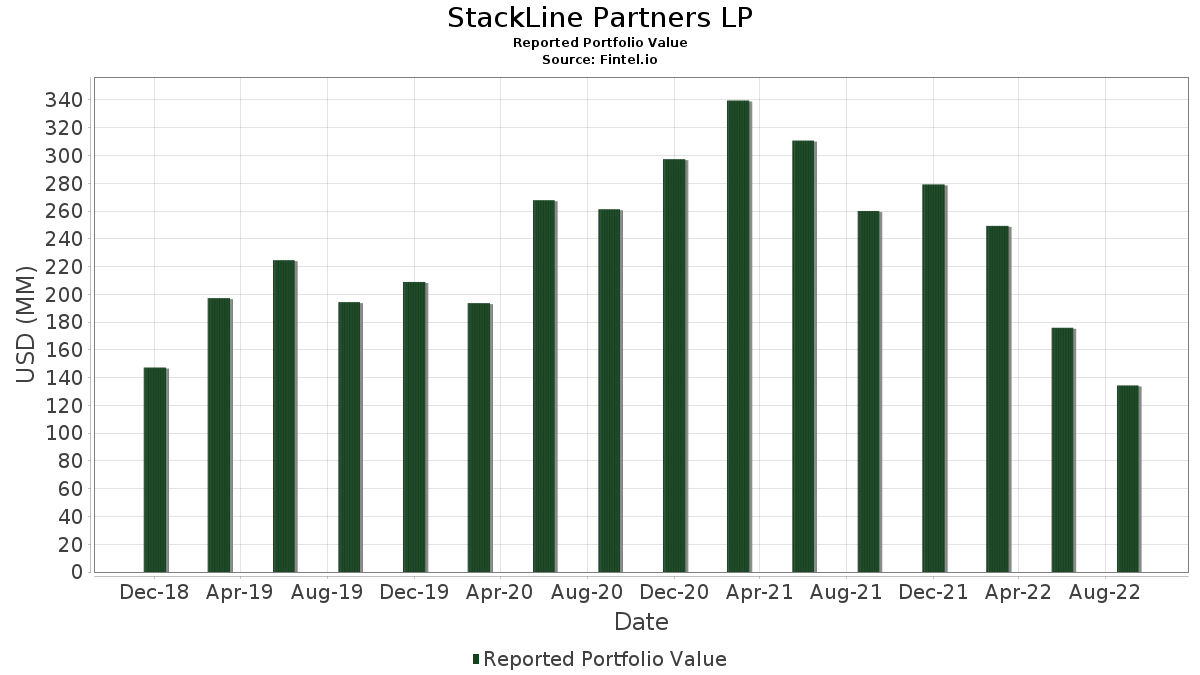
| Portfolio Value | $ 134,331,000 |
| Current Positions | 11 |
Latest Holdings, Performance, AUM (from 13F, 13D)
StackLine Partners LP has disclosed 11 total holdings in their latest SEC filings. Most recent portfolio value is calculated to be $ 134,331,000 USD. Actual Assets Under Management (AUM) is this value plus cash (which is not disclosed). StackLine Partners LP’s top holdings are Appian Corporation (US:APPN) , PTC Inc. (US:PTC) , Trinity Industries, Inc. (US:TRN) , The New York Times Company (US:NYT) , and Kirby Corporation (US:KEX) .
Top Increases This Quarter
We use the change in the portfolio allocation because this is the most meaningful metric. Changes can be due to trades or changes in share prices.
| Security | Shares (MM) |
Value (MM$) |
Portfolio % | ΔPortfolio % |
|---|---|---|---|---|
| 0.04 | 11.05 | 8.2252 | 4.1342 | |
| 0.60 | 24.67 | 18.3628 | 3.9723 | |
| 0.12 | 9.79 | 7.2895 | 2.6073 | |
| 0.73 | 5.40 | 4.0214 | 0.7798 | |
| 1.90 | 23.88 | 17.7777 | 0.7442 | |
| 0.41 | 11.74 | 8.7381 | 0.4482 | |
| 0.19 | 11.46 | 8.5341 | 0.3488 |
Top Decreases This Quarter
We use the change in the portfolio allocation because this is the most meaningful metric. Changes can be due to trades or changes in share prices.
| Security | Shares (MM) |
Value (MM$) |
Portfolio % | ΔPortfolio % |
|---|---|---|---|---|
| 0.00 | 0.00 | -8.4866 | ||
| 2.11 | 3.88 | 2.8891 | -1.7527 | |
| 0.02 | 2.38 | 1.7725 | -1.4634 | |
| 0.17 | 17.49 | 13.0201 | -0.9322 | |
| 0.59 | 12.59 | 9.3694 | -0.3998 |
13F and Fund Filings
This form was filed on 2022-11-14 for the reporting period 2022-09-30. Click the link icon to see the full transaction history.
Upgrade to unlock premium data and export to Excel ![]() .
.
| Security | Type | Avg Share Price | Shares (MM) |
ΔShares (%) |
ΔShares (%) |
Value ($MM) |
Portfolio (%) |
ΔPortfolio (%) |
|
|---|---|---|---|---|---|---|---|---|---|
| APPN / Appian Corporation | 0.60 | 13.03 | 24.67 | -2.55 | 18.3628 | 3.9723 | |||
| PRMW / Primo Water Corporation | 1.90 | -15.02 | 23.88 | -20.30 | 17.7777 | 0.7442 | |||
| PTC / PTC Inc. | 0.17 | -27.55 | 17.49 | -28.73 | 13.0201 | -0.9322 | |||
| TRN / Trinity Industries, Inc. | 0.59 | -16.91 | 12.59 | -26.76 | 9.3694 | -0.3998 | |||
| NYT / The New York Times Company | 0.41 | -21.89 | 11.74 | -19.50 | 8.7381 | 0.4482 | |||
| KEX / Kirby Corporation | 0.19 | -20.28 | 11.46 | -20.38 | 8.5341 | 0.3488 | |||
| RH / RH | 0.04 | 32.45 | 11.05 | 53.54 | 8.2252 | 4.1342 | |||
| LGIH / LGI Homes, Inc. | 0.12 | 26.98 | 9.79 | 18.89 | 7.2895 | 2.6073 | |||
| FTCH / Farfetch Limited | 0.73 | -8.94 | 5.40 | -5.26 | 4.0214 | 0.7798 | |||
| TDUP / ThredUp Inc. | 2.11 | -35.41 | 3.88 | -52.47 | 2.8891 | -1.7527 | |||
| FERG / Ferguson Enterprises Inc. | 0.02 | -55.01 | 2.38 | -58.17 | 1.7725 | -1.4634 | |||
| FTDR / Frontdoor, Inc. | 0.00 | -100.00 | 0.00 | -100.00 | -8.4866 |