Basic Stats
| Portfolio Value | $ 575,638,644 |
| Current Positions | 185 |
Latest Holdings, Performance, AUM (from 13F, 13D)
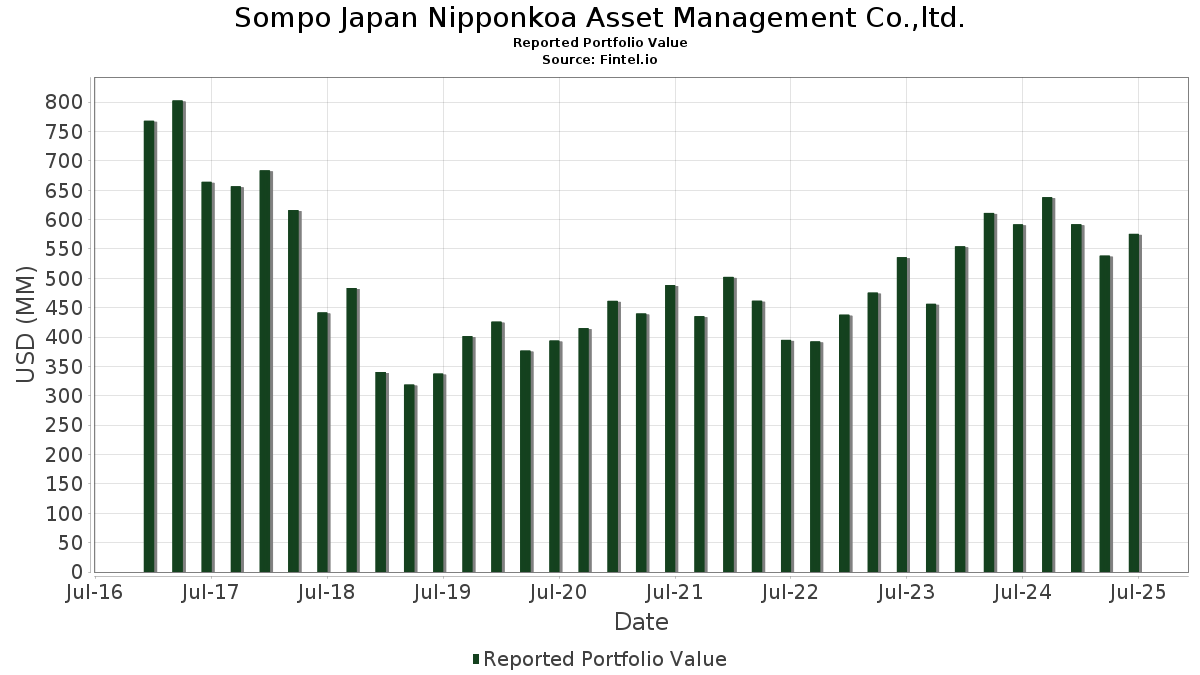
Sompo Japan Nipponkoa Asset Management Co.,ltd. has disclosed 185 total holdings in their latest SEC filings. Most recent portfolio value is calculated to be $ 575,638,644 USD. Actual Assets Under Management (AUM) is this value plus cash (which is not disclosed). Sompo Japan Nipponkoa Asset Management Co.,ltd.’s top holdings are Vanguard Index Funds - Vanguard S&P 500 ETF (US:VOO) , iShares, Inc. - iShares Core MSCI Emerging Markets ETF (US:IEMG) , iShares Trust - iShares 7-10 Year Treasury Bond ETF (US:IEF) , Microsoft Corporation (US:MSFT) , and NVIDIA Corporation (US:NVDA) .
Top Increases This Quarter
We use the change in the portfolio allocation because this is the most meaningful metric. Changes can be due to trades or changes in share prices.
| Security | Shares (MM) |
Value (MM$) |
Portfolio % | ΔPortfolio % |
|---|---|---|---|---|
| 0.16 | 25.13 | 4.3658 | 1.2834 | |
| 0.06 | 29.46 | 5.1186 | 1.0491 | |
| 0.02 | 6.33 | 1.0990 | 0.5453 | |
| 0.11 | 19.22 | 3.3395 | 0.4104 | |
| 0.08 | 47.92 | 8.3252 | 0.3824 | |
| 0.01 | 2.37 | 0.4115 | 0.3266 | |
| 0.03 | 10.04 | 1.7447 | 0.3174 | |
| 0.01 | 10.53 | 1.8298 | 0.2914 | |
| 0.02 | 7.77 | 1.3490 | 0.2692 | |
| 0.67 | 40.41 | 7.0200 | 0.2309 |
Top Decreases This Quarter
We use the change in the portfolio allocation because this is the most meaningful metric. Changes can be due to trades or changes in share prices.
| Security | Shares (MM) |
Value (MM$) |
Portfolio % | ΔPortfolio % |
|---|---|---|---|---|
| 0.10 | 20.97 | 3.6433 | -0.9566 | |
| 0.01 | 1.51 | 0.2622 | -0.4523 | |
| 0.05 | 7.06 | 1.2262 | -0.2360 | |
| 0.39 | 37.48 | 6.5111 | -0.2254 | |
| 0.04 | 14.58 | 2.5324 | -0.2070 | |
| 0.09 | 7.78 | 1.3523 | -0.1802 | |
| 0.00 | 1.04 | 0.1812 | -0.1732 | |
| 0.05 | 2.19 | 0.3804 | -0.1711 | |
| 0.01 | 2.15 | 0.3737 | -0.1664 | |
| 0.05 | 5.28 | 0.9167 | -0.1578 |
13F and Fund Filings
This form was filed on 2025-08-14 for the reporting period 2025-06-30. Click the link icon to see the full transaction history.
Upgrade to unlock premium data and export to Excel ![]() .
.
| Security | Type | Avg Share Price | Shares (MM) |
ΔShares (%) |
ΔShares (%) |
Value ($MM) |
Portfolio (%) |
ΔPortfolio (%) |
|
|---|---|---|---|---|---|---|---|---|---|
| VOO / Vanguard Index Funds - Vanguard S&P 500 ETF | 0.08 | 1.36 | 47.92 | 12.04 | 8.3252 | 0.3824 | |||
| IEMG / iShares, Inc. - iShares Core MSCI Emerging Markets ETF | 0.67 | -0.63 | 40.41 | 10.53 | 7.0200 | 0.2309 | |||
| IEF / iShares Trust - iShares 7-10 Year Treasury Bond ETF | 0.39 | 2.88 | 37.48 | 3.32 | 6.5111 | -0.2254 | |||
| MSFT / Microsoft Corporation | 0.06 | 1.47 | 29.46 | 34.45 | 5.1186 | 1.0491 | |||
| NVDA / NVIDIA Corporation | 0.16 | 3.86 | 25.13 | 51.40 | 4.3658 | 1.2834 | |||
| AAPL / Apple Inc. | 0.10 | -8.34 | 20.97 | -15.34 | 3.6433 | -0.9566 | |||
| GOOGL / Alphabet Inc. | 0.11 | 6.94 | 19.22 | 21.87 | 3.3395 | 0.4104 | |||
| V / Visa Inc. | 0.04 | -2.46 | 14.58 | -1.19 | 2.5324 | -0.2070 | |||
| AMZN / Amazon.com, Inc. | 0.06 | -9.43 | 13.57 | 4.44 | 2.3582 | -0.0554 | |||
| META / Meta Platforms, Inc. | 0.01 | -0.72 | 10.53 | 27.15 | 1.8298 | 0.2914 | |||
| ROK / Rockwell Automation, Inc. | 0.03 | 1.64 | 10.04 | 30.67 | 1.7447 | 0.3174 | |||
| ADBE / Adobe Inc. | 0.02 | 7.77 | 9.39 | 8.72 | 1.6318 | 0.0273 | |||
| JPM / JPMorgan Chase & Co. | 0.03 | -1.13 | 8.99 | 16.85 | 1.5623 | 0.1331 | |||
| KO / The Coca-Cola Company | 0.12 | -1.20 | 8.76 | -2.40 | 1.5212 | -0.1448 | |||
| CRM / Salesforce, Inc. | 0.03 | 6.69 | 8.31 | 8.42 | 1.4436 | 0.0202 | |||
| DIS / The Walt Disney Company | 0.06 | -2.76 | 7.98 | 22.18 | 1.3865 | 0.1734 | |||
| CVS / CVS Health Corporation | 0.11 | -3.31 | 7.93 | -1.56 | 1.3775 | -0.1183 | |||
| MDT / Medtronic plc | 0.09 | -2.77 | 7.78 | -5.68 | 1.3523 | -0.1802 | |||
| ULTA / Ulta Beauty, Inc. | 0.02 | 4.63 | 7.77 | 33.56 | 1.3490 | 0.2692 | |||
| JNJ / Johnson & Johnson | 0.05 | -2.67 | 7.06 | -10.35 | 1.2262 | -0.2360 | |||
| CSCO / Cisco Systems, Inc. | 0.10 | -1.49 | 6.62 | 10.77 | 1.1492 | 0.0401 | |||
| INTC / Intel Corporation | 0.29 | -4.84 | 6.51 | -6.14 | 1.1317 | -0.1572 | |||
| AVGO / Broadcom Inc. | 0.02 | 28.86 | 6.33 | 112.21 | 1.0990 | 0.5453 | |||
| C / Citigroup Inc. | 0.07 | -12.58 | 5.84 | 4.83 | 1.0149 | -0.0201 | |||
| SYY / Sysco Corporation | 0.08 | -3.12 | 5.82 | -2.22 | 1.0106 | -0.0941 | |||
| QCOM / QUALCOMM Incorporated | 0.04 | -2.12 | 5.67 | 1.49 | 0.9849 | -0.0525 | |||
| UNP / Union Pacific Corporation | 0.02 | 5.84 | 5.56 | 3.08 | 0.9667 | -0.0358 | |||
| UPS / United Parcel Service, Inc. | 0.05 | -0.63 | 5.28 | -8.81 | 0.9167 | -0.1578 | |||
| SPGI / S&P Global Inc. | 0.01 | 0.10 | 5.04 | 3.90 | 0.8751 | -0.0253 | |||
| SWK / Stanley Black & Decker, Inc. | 0.07 | 4.40 | 5.00 | -8.01 | 0.8680 | -0.1405 | |||
| AMCR / Amcor plc | 0.53 | 1.63 | 4.92 | -3.70 | 0.8538 | -0.0940 | |||
| BAC / Bank of America Corporation | 0.10 | -1.68 | 4.62 | 11.50 | 0.8034 | 0.0331 | |||
| TFC / Truist Financial Corporation | 0.10 | -3.97 | 4.40 | 0.32 | 0.7637 | -0.0500 | |||
| NKE / NIKE, Inc. | 0.06 | 8.40 | 4.36 | 21.30 | 0.7568 | 0.0899 | |||
| HD / The Home Depot, Inc. | 0.01 | -0.26 | 4.14 | -0.24 | 0.7195 | -0.0513 | |||
| ACN / Accenture plc | 0.01 | 0.59 | 4.11 | -3.66 | 0.7134 | -0.0781 | |||
| WMT / Walmart Inc. | 0.04 | -14.53 | 3.78 | -4.79 | 0.6567 | -0.0807 | |||
| VZ / Verizon Communications Inc. | 0.09 | -1.53 | 3.77 | -6.06 | 0.6548 | -0.0903 | |||
| CL / Colgate-Palmolive Company | 0.04 | -1.55 | 3.68 | -4.51 | 0.6401 | -0.0763 | |||
| TXN / Texas Instruments Incorporated | 0.02 | 5.09 | 3.60 | 21.42 | 0.6254 | 0.0748 | |||
| MRK / Merck & Co., Inc. | 0.04 | -4.44 | 3.34 | -15.73 | 0.5800 | -0.1557 | |||
| LYB / LyondellBasell Industries N.V. | 0.06 | 5.35 | 3.20 | -13.40 | 0.5558 | -0.1303 | |||
| COP / ConocoPhillips | 0.03 | -1.02 | 2.87 | -15.43 | 0.4991 | -0.1317 | |||
| LLY / Eli Lilly and Company | 0.00 | 1.71 | 2.78 | -4.00 | 0.4834 | -0.0549 | |||
| AKAM / Akamai Technologies, Inc. | 0.03 | 9.50 | 2.41 | 8.46 | 0.4186 | 0.0062 | |||
| IBM / International Business Machines Corporation | 0.01 | 2.15 | 2.38 | 21.10 | 0.4129 | 0.0484 | |||
| AMAT / Applied Materials, Inc. | 0.01 | 310.79 | 2.37 | 418.16 | 0.4115 | 0.3266 | |||
| ALL / The Allstate Corporation | 0.01 | -2.78 | 2.25 | -5.50 | 0.3913 | -0.0512 | |||
| BMY / Bristol-Myers Squibb Company | 0.05 | -2.85 | 2.19 | -26.27 | 0.3804 | -0.1711 | |||
| INTU / Intuit Inc. | 0.00 | -21.31 | 2.18 | 0.93 | 0.3790 | -0.0223 | |||
| MMC / Marsh & McLennan Companies, Inc. | 0.01 | -17.45 | 2.15 | -26.03 | 0.3737 | -0.1664 | |||
| KLAC / KLA Corporation | 0.00 | 10.47 | 2.15 | 45.59 | 0.3728 | 0.0990 | |||
| AVY / Avery Dennison Corporation | 0.01 | -1.52 | 2.11 | -2.91 | 0.3658 | -0.0369 | |||
| ROST / Ross Stores, Inc. | 0.02 | 11.47 | 2.02 | 11.34 | 0.3514 | 0.0139 | |||
| NFLX / Netflix, Inc. | 0.00 | 1.35 | 2.01 | 45.51 | 0.3490 | 0.0927 | |||
| D / Dominion Energy, Inc. | 0.03 | -2.97 | 1.83 | -2.20 | 0.3171 | -0.0295 | |||
| EXC / Exelon Corporation | 0.04 | 1.23 | 1.82 | -4.60 | 0.3170 | -0.0382 | |||
| SHW / The Sherwin-Williams Company | 0.01 | -4.20 | 1.80 | -5.80 | 0.3132 | -0.0422 | |||
| BKNG / Booking Holdings Inc. | 0.00 | -3.12 | 1.79 | 21.71 | 0.3118 | 0.0380 | |||
| NEE / NextEra Energy, Inc. | 0.03 | 14.67 | 1.74 | 12.27 | 0.3020 | 0.0145 | |||
| GS / The Goldman Sachs Group, Inc. | 0.00 | 0.00 | 1.67 | 29.56 | 0.2902 | 0.0508 | |||
| PM / Philip Morris International Inc. | 0.01 | 9.84 | 1.61 | 26.06 | 0.2791 | 0.0424 | |||
| COST / Costco Wholesale Corporation | 0.00 | 0.00 | 1.54 | 4.68 | 0.2683 | -0.0057 | |||
| AXP / American Express Company | 0.00 | 10.50 | 1.54 | 30.98 | 0.2682 | 0.0494 | |||
| ORCL / Oracle Corporation | 0.01 | 2.80 | 1.52 | 60.82 | 0.2647 | 0.0887 | |||
| KMX / CarMax, Inc. | 0.02 | -6.07 | 1.52 | -19.00 | 0.2638 | -0.0842 | |||
| MMM / 3M Company | 0.01 | -62.16 | 1.51 | -60.77 | 0.2622 | -0.4523 | |||
| TJX / The TJX Companies, Inc. | 0.01 | 0.42 | 1.49 | 1.85 | 0.2585 | -0.0129 | |||
| AON / Aon plc | 0.00 | 2.21 | 1.48 | -8.62 | 0.2578 | -0.0438 | |||
| GD / General Dynamics Corporation | 0.00 | 4.20 | 1.45 | 11.49 | 0.2513 | 0.0104 | |||
| ABT / Abbott Laboratories | 0.01 | 4.40 | 1.36 | 7.11 | 0.2356 | 0.0003 | |||
| LRCX / Lam Research Corporation | 0.01 | 222.25 | 1.34 | 331.94 | 0.2327 | 0.1750 | |||
| CCI / Crown Castle Inc. | 0.01 | 14.18 | 1.27 | 12.56 | 0.2213 | 0.0111 | |||
| MS / Morgan Stanley | 0.01 | 0.00 | 1.15 | 20.67 | 0.1999 | 0.0229 | |||
| SPY / SPDR S&P 500 ETF | 0.00 | 47.20 | 1.14 | 62.52 | 0.1975 | 0.0676 | |||
| APH / Amphenol Corporation | 0.01 | -14.84 | 1.13 | 28.17 | 0.1969 | 0.0328 | |||
| WFC / Wells Fargo & Company | 0.01 | -23.21 | 1.13 | -14.31 | 0.1957 | -0.0484 | |||
| ABBV / AbbVie Inc. | 0.01 | 0.00 | 1.10 | -11.43 | 0.1912 | -0.0395 | |||
| CAG / Conagra Brands, Inc. | 0.05 | 1.07 | 0.1866 | 0.1866 | |||||
| PRU / Prudential Financial, Inc. | 0.01 | 1.94 | 1.07 | -1.92 | 0.1861 | -0.0167 | |||
| STT / State Street Corporation | 0.01 | -41.12 | 1.07 | -30.08 | 0.1854 | -0.0980 | |||
| IVV / iShares Trust - iShares Core S&P 500 ETF | 0.00 | -50.54 | 1.04 | -45.34 | 0.1812 | -0.1732 | |||
| QFIN / Qfin Holdings, Inc. - Depositary Receipt (Common Stock) | 0.02 | 15.52 | 1.03 | 11.45 | 0.1794 | 0.0075 | |||
| RTX / RTX Corporation | 0.01 | 6.04 | 1.03 | 17.01 | 0.1781 | 0.0152 | |||
| T / AT&T Inc. | 0.04 | 26.17 | 1.02 | 29.04 | 0.1777 | 0.0306 | |||
| IBN / ICICI Bank Limited - Depositary Receipt (Common Stock) | 0.03 | -18.26 | 1.01 | -12.77 | 0.1758 | -0.0396 | |||
| ADP / Automatic Data Processing, Inc. | 0.00 | 13.83 | 0.99 | 14.87 | 0.1720 | 0.0120 | |||
| KKR / KKR & Co. Inc. | 0.01 | -3.59 | 0.96 | 10.93 | 0.1675 | 0.0061 | |||
| CAT / Caterpillar Inc. | 0.00 | 1.24 | 0.95 | 19.17 | 0.1652 | 0.0170 | |||
| FICO / Fair Isaac Corporation | 0.00 | 8.33 | 0.95 | 7.34 | 0.1651 | 0.0008 | |||
| SYK / Stryker Corporation | 0.00 | 1.27 | 0.95 | 7.63 | 0.1643 | 0.0011 | |||
| FI / Fiserv, Inc. | 0.01 | 38.83 | 0.94 | 8.39 | 0.1638 | 0.0023 | |||
| XYZ / Block, Inc. | 0.01 | -4.01 | 0.93 | 19.92 | 0.1612 | 0.0176 | |||
| NDAQ / Nasdaq, Inc. | 0.01 | 175.53 | 0.93 | 224.91 | 0.1609 | 0.1080 | |||
| ETN / Eaton Corporation plc | 0.00 | 0.00 | 0.91 | 31.30 | 0.1575 | 0.0293 | |||
| MSCI / MSCI Inc. | 0.00 | 0.00 | 0.89 | 1.94 | 0.1553 | -0.0075 | |||
| BK / The Bank of New York Mellon Corporation | 0.01 | -35.77 | 0.87 | -30.27 | 0.1518 | -0.0807 | |||
| PLD / Prologis, Inc. | 0.01 | -8.86 | 0.87 | -14.27 | 0.1503 | -0.0372 | |||
| FUTU / Futu Holdings Limited - Depositary Receipt (Common Stock) | 0.01 | 0.00 | 0.86 | 20.70 | 0.1501 | 0.0172 | |||
| SLB / Schlumberger Limited | 0.02 | 73.94 | 0.83 | 40.64 | 0.1450 | 0.0348 | |||
| VRSK / Verisk Analytics, Inc. | 0.00 | 0.00 | 0.80 | 4.73 | 0.1385 | -0.0030 | |||
| UNH / UnitedHealth Group Incorporated | 0.00 | -0.40 | 0.78 | -40.64 | 0.1360 | -0.1091 | |||
| PG / The Procter & Gamble Company | 0.00 | 1.03 | 0.78 | -5.46 | 0.1353 | -0.0178 | |||
| PH / Parker-Hannifin Corporation | 0.00 | 0.00 | 0.78 | 14.99 | 0.1347 | 0.0094 | |||
| EPAM / EPAM Systems, Inc. | 0.00 | 0.00 | 0.77 | 4.77 | 0.1336 | -0.0028 | |||
| GILD / Gilead Sciences, Inc. | 0.01 | 1.19 | 0.76 | 0.13 | 0.1314 | -0.0089 | |||
| EMR / Emerson Electric Co. | 0.01 | 14.11 | 0.75 | 38.86 | 0.1311 | 0.0301 | |||
| TRU / TransUnion | 0.01 | 0.00 | 0.75 | 6.06 | 0.1307 | -0.0011 | |||
| SRE / Sempra | 0.01 | 0.00 | 0.74 | 6.16 | 0.1289 | -0.0009 | |||
| CDNS / Cadence Design Systems, Inc. | 0.00 | -47.87 | 0.72 | -36.88 | 0.1247 | -0.0864 | |||
| LMT / Lockheed Martin Corporation | 0.00 | 4.05 | 0.71 | 7.87 | 0.1239 | 0.0011 | |||
| DE / Deere & Company | 0.00 | 1.46 | 0.71 | 9.80 | 0.1228 | 0.0034 | |||
| SCHW / The Charles Schwab Corporation | 0.01 | 0.00 | 0.70 | 16.56 | 0.1224 | 0.0101 | |||
| BLK / BlackRock, Inc. | 0.00 | 0.00 | 0.69 | 10.90 | 0.1203 | 0.0043 | |||
| CME / CME Group Inc. | 0.00 | 5.51 | 0.69 | 9.58 | 0.1192 | 0.0030 | |||
| MCD / McDonald's Corporation | 0.00 | 5.45 | 0.68 | -1.46 | 0.1178 | -0.0099 | |||
| VGK / Vanguard International Equity Index Funds - Vanguard FTSE Europe ETF | 0.01 | -54.51 | 0.67 | -49.81 | 0.1165 | -0.1315 | |||
| LOW / Lowe's Companies, Inc. | 0.00 | 87.58 | 0.67 | 78.67 | 0.1164 | 0.0467 | |||
| CEG / Constellation Energy Corporation | 0.00 | 0.00 | 0.66 | 60.05 | 0.1149 | 0.0382 | |||
| CTVA / Corteva, Inc. | 0.01 | 0.00 | 0.66 | 18.46 | 0.1148 | 0.0112 | |||
| HON / Honeywell International Inc. | 0.00 | 5.62 | 0.66 | 16.11 | 0.1141 | 0.0091 | |||
| WM / Waste Management, Inc. | 0.00 | 0.00 | 0.65 | -1.22 | 0.1125 | -0.0092 | |||
| ZTS / Zoetis Inc. | 0.00 | -0.73 | 0.64 | -5.92 | 0.1105 | -0.0151 | |||
| CVX / Chevron Corporation | 0.00 | -9.78 | 0.63 | -22.80 | 0.1101 | -0.0423 | |||
| ALKT / Alkami Technology, Inc. | 0.02 | 0.00 | 0.63 | 14.84 | 0.1091 | 0.0075 | |||
| PSA / Public Storage | 0.00 | -15.81 | 0.62 | -17.57 | 0.1086 | -0.0320 | |||
| EL / The Estée Lauder Companies Inc. | 0.01 | 23.67 | 0.62 | 51.59 | 0.1078 | 0.0317 | |||
| FIS / Fidelity National Information Services, Inc. | 0.01 | 0.00 | 0.62 | 8.99 | 0.1075 | 0.0021 | |||
| MA / Mastercard Incorporated | 0.00 | 0.00 | 0.62 | 2.66 | 0.1074 | -0.0046 | |||
| TT / Trane Technologies plc | 0.00 | 0.00 | 0.62 | 29.68 | 0.1071 | 0.0189 | |||
| BR / Broadridge Financial Solutions, Inc. | 0.00 | 0.00 | 0.60 | 0.17 | 0.1039 | -0.0069 | |||
| SBUX / Starbucks Corporation | 0.01 | 0.00 | 0.59 | -6.64 | 0.1028 | -0.0148 | |||
| AMGN / Amgen Inc. | 0.00 | -48.59 | 0.58 | -53.97 | 0.1009 | -0.1332 | |||
| ED / Consolidated Edison, Inc. | 0.01 | 39.51 | 0.57 | 26.62 | 0.0985 | 0.0153 | |||
| MCK / McKesson Corporation | 0.00 | -20.21 | 0.55 | -13.13 | 0.0955 | -0.0220 | |||
| CTSH / Cognizant Technology Solutions Corporation | 0.01 | 16.98 | 0.54 | 19.33 | 0.0934 | 0.0097 | |||
| JCI / Johnson Controls International plc | 0.01 | 0.00 | 0.53 | 32.00 | 0.0917 | 0.0174 | |||
| TEL / TE Connectivity plc | 0.00 | 81.87 | 0.52 | 117.43 | 0.0911 | 0.0463 | |||
| CPAY / Corpay, Inc. | 0.00 | 0.00 | 0.52 | -4.96 | 0.0899 | -0.0111 | |||
| AVB / AvalonBay Communities, Inc. | 0.00 | 0.00 | 0.51 | -5.17 | 0.0894 | -0.0114 | |||
| PCAR / PACCAR Inc | 0.01 | -11.71 | 0.50 | -13.92 | 0.0872 | -0.0209 | |||
| ELV / Elevance Health, Inc. | 0.00 | 5.74 | 0.50 | -5.47 | 0.0872 | -0.0114 | |||
| CAH / Cardinal Health, Inc. | 0.00 | 0.00 | 0.49 | 21.73 | 0.0858 | 0.0106 | |||
| PNC / The PNC Financial Services Group, Inc. | 0.00 | -12.58 | 0.49 | -7.17 | 0.0855 | -0.0131 | |||
| PGR / The Progressive Corporation | 0.00 | 0.00 | 0.47 | -5.66 | 0.0811 | -0.0108 | |||
| IT / Gartner, Inc. | 0.00 | 0.00 | 0.45 | -3.83 | 0.0786 | -0.0086 | |||
| EQIX / Equinix, Inc. | 0.00 | 0.00 | 0.43 | -2.50 | 0.0746 | -0.0071 | |||
| BXP / Boston Properties, Inc. | 0.01 | 0.00 | 0.43 | 0.47 | 0.0742 | -0.0048 | |||
| VMC / Vulcan Materials Company | 0.00 | -23.47 | 0.43 | -14.31 | 0.0739 | -0.0184 | |||
| USB / U.S. Bancorp | 0.01 | 0.00 | 0.42 | 7.38 | 0.0733 | 0.0002 | |||
| GM / General Motors Company | 0.01 | -26.06 | 0.42 | -22.74 | 0.0727 | -0.0278 | |||
| CPRT / Copart, Inc. | 0.01 | -23.02 | 0.41 | -33.22 | 0.0713 | -0.0429 | |||
| SPG / Simon Property Group, Inc. | 0.00 | 0.00 | 0.40 | -3.17 | 0.0690 | -0.0072 | |||
| COR / Cencora, Inc. | 0.00 | 0.00 | 0.38 | 7.65 | 0.0662 | 0.0006 | |||
| ICE / Intercontinental Exchange, Inc. | 0.00 | -45.07 | 0.38 | -41.64 | 0.0657 | -0.0545 | |||
| APTV / Aptiv PLC | 0.01 | -14.37 | 0.38 | -1.82 | 0.0657 | -0.0058 | |||
| CMCSA / Comcast Corporation | 0.01 | -15.73 | 0.38 | -18.44 | 0.0654 | -0.0204 | |||
| MDLZ / Mondelez International, Inc. | 0.01 | 13.99 | 0.37 | 13.37 | 0.0649 | 0.0037 | |||
| EA / Electronic Arts Inc. | 0.00 | 0.00 | 0.37 | 10.61 | 0.0635 | 0.0021 | |||
| PYPL / PayPal Holdings, Inc. | 0.00 | 0.00 | 0.36 | 14.06 | 0.0621 | 0.0038 | |||
| G / Genpact Limited | 0.01 | 0.00 | 0.35 | -12.81 | 0.0604 | -0.0135 | |||
| PFE / Pfizer Inc. | 0.01 | -34.40 | 0.34 | -37.25 | 0.0594 | -0.0418 | |||
| BRK.B / Berkshire Hathaway Inc. | 0.00 | 0.00 | 0.34 | -8.60 | 0.0591 | -0.0102 | |||
| LC / LendingClub Corporation | 0.03 | -44.47 | 0.34 | -35.25 | 0.0588 | -0.0383 | |||
| DHI / D.R. Horton, Inc. | 0.00 | 0.78 | 0.33 | 2.16 | 0.0576 | -0.0026 | |||
| EMN / Eastman Chemical Company | 0.00 | 2.39 | 0.32 | -13.32 | 0.0555 | -0.0129 | |||
| DAVA / Endava plc - Depositary Receipt (Common Stock) | 0.02 | 54.15 | 0.32 | 21.37 | 0.0553 | 0.0065 | |||
| CB / Chubb Limited | 0.00 | 26.74 | 0.32 | 21.62 | 0.0549 | 0.0066 | |||
| TW / Tradeweb Markets Inc. | 0.00 | 0.00 | 0.31 | -1.27 | 0.0539 | -0.0045 | |||
| BEKE / KE Holdings Inc. - Depositary Receipt (Common Stock) | 0.02 | 0.00 | 0.31 | -11.68 | 0.0539 | -0.0113 | |||
| BABA / Alibaba Group Holding Limited - Depositary Receipt (Common Stock) | 0.00 | 0.00 | 0.31 | -14.17 | 0.0538 | -0.0132 | |||
| TGT / Target Corporation | 0.00 | -10.91 | 0.30 | -15.86 | 0.0518 | -0.0139 | |||
| AZO / AutoZone, Inc. | 0.00 | 33.33 | 0.30 | 29.82 | 0.0516 | 0.0091 | |||
| HDB / HDFC Bank Limited - Depositary Receipt (Common Stock) | 0.00 | 0.00 | 0.29 | 15.42 | 0.0507 | 0.0037 | |||
| PFG / Principal Financial Group, Inc. | 0.00 | 0.00 | 0.29 | -5.63 | 0.0495 | -0.0067 | |||
| PEP / PepsiCo, Inc. | 0.00 | -8.21 | 0.25 | -19.35 | 0.0436 | -0.0141 | |||
| OMC / Omnicom Group Inc. | 0.00 | 0.58 | 0.25 | -12.94 | 0.0434 | -0.0098 | |||
| STZ / Constellation Brands, Inc. | 0.00 | -33.92 | 0.24 | -41.35 | 0.0424 | -0.0350 | |||
| SO / The Southern Company | 0.00 | -5.68 | 0.23 | -5.79 | 0.0397 | -0.0054 | |||
| MET / MetLife, Inc. | 0.00 | -33.72 | 0.23 | -33.63 | 0.0395 | -0.0241 | |||
| AFL / Aflac Incorporated | 0.00 | 0.00 | 0.23 | -5.44 | 0.0394 | -0.0050 | |||
| ITUB / Itaú Unibanco Holding S.A. - Depositary Receipt (Common Stock) | 0.03 | -19.29 | 0.22 | -0.45 | 0.0381 | -0.0028 | |||
| VALE / Vale S.A. - Depositary Receipt (Common Stock) | 0.02 | -18.68 | 0.22 | -20.66 | 0.0374 | -0.0131 | |||
| ZBH / Zimmer Biomet Holdings, Inc. | 0.00 | -16.96 | 0.21 | -33.12 | 0.0372 | -0.0222 | |||
| XOM / Exxon Mobil Corporation | 0.00 | -12.62 | 0.20 | -20.87 | 0.0350 | -0.0122 | |||
| CPB / The Campbell's Company | 0.00 | -100.00 | 0.00 | 0.0000 | |||||
| WMB / The Williams Companies, Inc. | 0.00 | -100.00 | 0.00 | 0.0000 | |||||
| BDX / Becton, Dickinson and Company | 0.00 | -100.00 | 0.00 | 0.0000 | |||||
| PBR.A / Petróleo Brasileiro S.A. - Petrobras - Depositary Receipt (Common Stock) | 0.00 | -100.00 | 0.00 | 0.0000 | |||||
| FDX / FedEx Corporation | 0.00 | -100.00 | 0.00 | 0.0000 | |||||
| KNX / Knight-Swift Transportation Holdings Inc. | 0.00 | -100.00 | 0.00 | 0.0000 | |||||
| RPAY / Repay Holdings Corporation | 0.00 | -100.00 | 0.00 | 0.0000 | |||||
| EOG / EOG Resources, Inc. | 0.00 | -100.00 | 0.00 | 0.0000 | |||||
| AMT / American Tower Corporation | 0.00 | -100.00 | 0.00 | 0.0000 |