Basic Stats
| Portfolio Value | $ 12,800,000 |
| Current Positions | 41 |
Latest Holdings, Performance, AUM (from 13F, 13D)
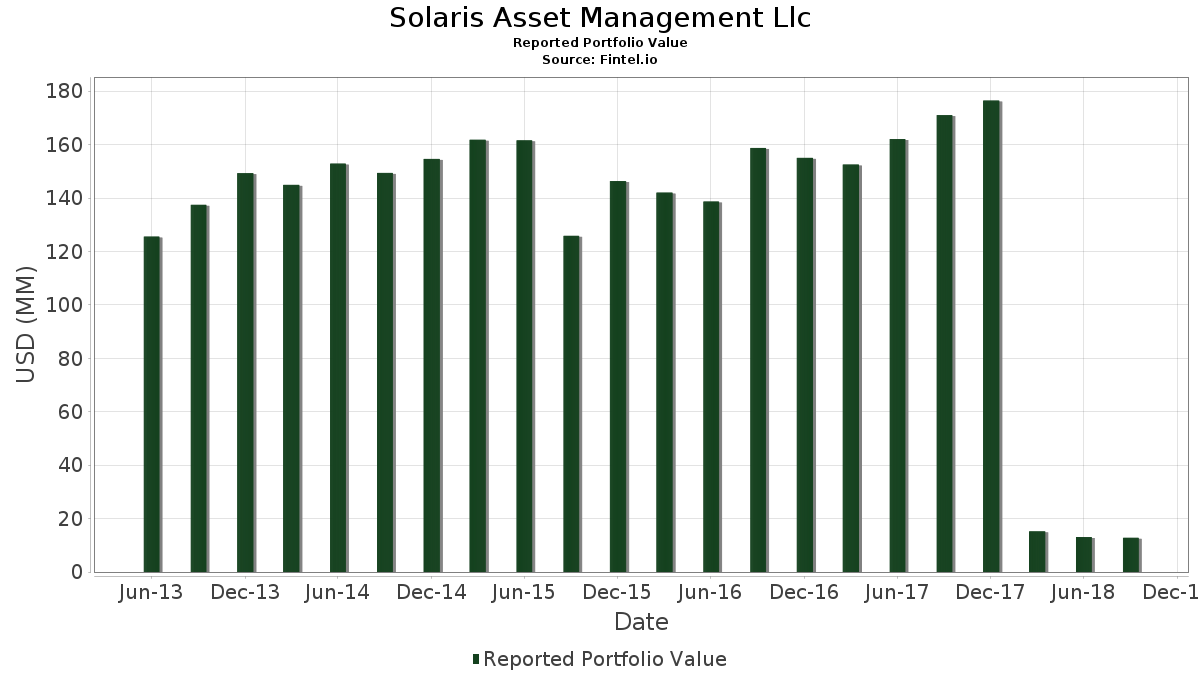
Solaris Asset Management Llc has disclosed 41 total holdings in their latest SEC filings. Most recent portfolio value is calculated to be $ 12,800,000 USD. Actual Assets Under Management (AUM) is this value plus cash (which is not disclosed). Solaris Asset Management Llc’s top holdings are Apple Inc. (US:AAPL) , Microsoft Corporation (US:MSFT) , Union Pacific Corporation (US:UNP) , Cintas Corporation (US:CTAS) , and Aetna, Inc. (US:AET) .
Top Increases This Quarter
We use the change in the portfolio allocation because this is the most meaningful metric. Changes can be due to trades or changes in share prices.
| Security | Shares (MM) |
Value (MM$) |
Portfolio % | ΔPortfolio % |
|---|---|---|---|---|
| 0.01 | 1.50 | 11.7344 | 1.9649 | |
| 0.00 | 0.24 | 1.8438 | 1.8438 | |
| 0.00 | 0.23 | 1.8281 | 1.8281 | |
| 0.00 | 0.20 | 1.5781 | 1.5781 | |
| 0.00 | 0.48 | 3.7656 | 1.1782 | |
| 0.01 | 1.14 | 8.9141 | 1.0527 | |
| 0.01 | 1.34 | 10.4531 | 1.0271 | |
| 0.00 | 1.00 | 7.8047 | 0.9050 | |
| 0.00 | 0.11 | 0.8828 | 0.8828 | |
| 0.00 | 0.11 | 0.8359 | 0.8359 |
Top Decreases This Quarter
We use the change in the portfolio allocation because this is the most meaningful metric. Changes can be due to trades or changes in share prices.
| Security | Shares (MM) |
Value (MM$) |
Portfolio % | ΔPortfolio % |
|---|---|---|---|---|
| 0.00 | 0.27 | 2.0781 | -7.4395 | |
| 0.00 | 0.31 | 2.4219 | -0.7379 | |
| 0.00 | 0.24 | 1.8516 | -0.2550 | |
| 0.00 | 0.05 | 0.4062 | -0.2349 | |
| 0.00 | 0.14 | 1.0781 | -0.1507 | |
| 0.00 | 0.33 | 2.5469 | -0.1168 | |
| 0.01 | 0.06 | 0.4922 | -0.0879 | |
| 0.00 | 0.09 | 0.6953 | -0.0603 | |
| 0.01 | 0.84 | 6.5312 | -0.0403 | |
| 0.00 | 0.03 | 0.2188 | -0.0331 |
13F and Fund Filings
This form was filed on 2018-10-24 for the reporting period 2018-09-30. Click the link icon to see the full transaction history.
Upgrade to unlock premium data and export to Excel ![]() .
.
| Security | Type | Avg Share Price | Shares (MM) |
ΔShares (%) |
ΔShares (%) |
Value ($MM) |
Portfolio (%) |
ΔPortfolio (%) |
|
|---|---|---|---|---|---|---|---|---|---|
| AAPL / Apple Inc. | 0.01 | -3.76 | 1.50 | 17.34 | 11.7344 | 1.9649 | |||
| MSFT / Microsoft Corporation | 0.01 | -6.59 | 1.34 | 8.34 | 10.4531 | 1.0271 | |||
| UNP / Union Pacific Corporation | 0.01 | -3.58 | 1.14 | 10.78 | 8.9141 | 1.0527 | |||
| CTAS / Cintas Corporation | 0.01 | -3.78 | 1.01 | 2.86 | 7.8672 | 0.3950 | |||
| AET / Aetna, Inc. | 0.00 | 0.00 | 1.00 | 10.51 | 7.8047 | 0.9050 | |||
| PNC / The PNC Financial Services Group, Inc. | 0.01 | -3.76 | 0.84 | -2.90 | 6.5312 | -0.0403 | |||
| DFS / Discover Financial Services | 0.01 | -0.74 | 0.77 | 7.82 | 6.0312 | 0.5664 | |||
| AMZN / Amazon.com, Inc. | 0.00 | -11.43 | 0.62 | 4.37 | 4.8516 | 0.3103 | |||
| ADBE / Adobe Inc. | 0.00 | -7.16 | 0.54 | 2.84 | 4.2422 | 0.2123 | |||
| IAC / IAC Inc. | 0.00 | 0.00 | 0.48 | 42.18 | 3.7656 | 1.1782 | |||
| NICE / NICE Ltd. - Depositary Receipt (Common Stock) | 0.00 | -10.67 | 0.34 | -1.47 | 2.6172 | 0.0222 | |||
| GOOG / Alphabet Inc. | 0.00 | -12.78 | 0.33 | -6.59 | 2.5469 | -0.1168 | |||
| META / Meta Platforms, Inc. | 0.00 | -11.73 | 0.31 | -25.12 | 2.4219 | -0.7379 | |||
| TFX / Teleflex Incorporated | 0.00 | -78.49 | 0.27 | -78.67 | 2.0781 | -7.4395 | |||
| PSCH / Invesco Exchange-Traded Fund Trust II - Invesco S&P SmallCap Health Care ETF | 0.00 | 0.00 | 0.24 | 9.22 | 1.8516 | 0.1953 | |||
| IWD / iShares Trust - iShares Russell 1000 Value ETF | 0.00 | 0.00 | 0.24 | 4.41 | 1.8516 | 0.1190 | |||
| MMP / Magellan Midstream Partners L.P. | 0.00 | -12.50 | 0.24 | -14.13 | 1.8516 | -0.2550 | |||
| RTN / Raytheon Co. | 0.00 | 0.00 | 0.24 | 6.79 | 1.8438 | 1.8438 | |||
| VCSH / Vanguard Scottsdale Funds - Vanguard Short-Term Corporate Bond ETF | 0.00 | 0.00 | 0.23 | 0.00 | 1.8281 | 1.8281 | |||
| NFG / National Fuel Gas Company | 0.00 | 0.00 | 0.20 | 5.76 | 1.5781 | 1.5781 | |||
| DLX / Deluxe Corporation | 0.00 | 0.00 | 0.14 | -14.29 | 1.0781 | -0.1507 | |||
| WMT / Walmart Inc. | 0.00 | 0.00 | 0.11 | 9.71 | 0.8828 | 0.8828 | |||
| VGIT / Vanguard Scottsdale Funds - Vanguard Intermediate-Term Treasury ETF | 0.00 | 0.00 | 0.11 | -0.93 | 0.8359 | 0.8359 | |||
| T / AT&T Inc. | 0.00 | -13.95 | 0.09 | -10.10 | 0.6953 | -0.0603 | |||
| MBB / iShares Trust - iShares MBS ETF | 0.00 | 0.00 | 0.08 | -1.20 | 0.6406 | 0.0071 | |||
| RDS.B / Shell Plc - ADR | 0.00 | 0.00 | 0.07 | -2.67 | 0.5703 | 0.5703 | |||
| IVV / iShares Trust - iShares Core S&P 500 ETF | 0.00 | 0.07 | 0.5156 | 0.5156 | |||||
| GE / General Electric Company | 0.01 | 0.00 | 0.06 | -17.11 | 0.4922 | -0.0879 | |||
| COP / ConocoPhillips | 0.00 | -44.00 | 0.05 | -38.10 | 0.4062 | -0.2349 | |||
| IWM / iShares Trust - iShares Russell 2000 ETF | 0.00 | 0.04 | 0.2734 | 0.2734 | |||||
| GM / General Motors Company | 0.00 | 0.00 | 0.03 | -15.15 | 0.2188 | -0.0331 | |||
| AMJ / JPMorgan Alerian MLP Index ETN - Corporate Bond/Note | 0.00 | 0.00 | 0.02 | 4.35 | 0.1875 | 0.0120 | |||
| IRM / Iron Mountain Incorporated | 0.00 | 0.00 | 0.02 | 0.00 | 0.1484 | 0.0034 | |||
| VOD / Vodafone Group Public Limited Company - Depositary Receipt (Common Stock) | 0.00 | 0.00 | 0.02 | -5.88 | 0.1250 | 0.1250 | |||
| VUG / Vanguard Index Funds - Vanguard Growth ETF | 0.00 | 0.00 | 0.01 | 14.29 | 0.0625 | 0.0091 | |||
| GM.WS.B / General Motors Company - Warrants 07/10/2019 | 0.00 | 0.00 | 0.01 | -22.22 | 0.0547 | -0.0140 | |||
| ITW / Illinois Tool Works Inc. | 0.00 | 0.00 | 0.01 | 0.00 | 0.0547 | 0.0547 | |||
| PSCT / Invesco Exchange-Traded Fund Trust II - Invesco S&P SmallCap Information Technology ETF | 0.00 | 0.00 | 0.00 | 0.00 | 0.0312 | 0.0007 | |||
| LKM / Link Motion Inc. | 0.01 | 0.00 | 0.00 | -42.86 | 0.0312 | 0.0312 | |||
| PSCF / Invesco Exchange-Traded Fund Trust II - Invesco S&P SmallCap Financials ETF | 0.00 | 0.00 | 0.00 | 0.00 | 0.0234 | 0.0005 | |||
| US62010U1016 / Motors Liquidation Company GUC Trust | 0.00 | 0.00 | 0.00 | 0.00 | 0.0078 | 0.0002 |