Basic Stats
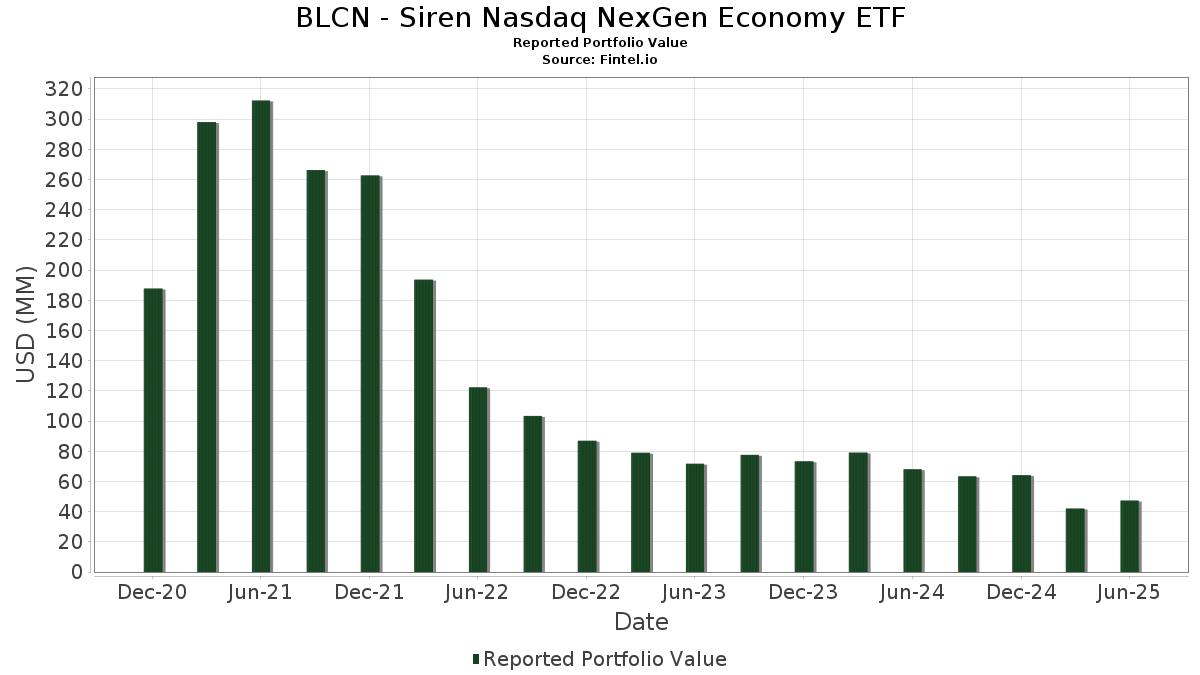
| Portfolio Value | $ 47,297,991 |
| Current Positions | 49 |
Latest Holdings, Performance, AUM (from 13F, 13D)
BLCN - Siren Nasdaq NexGen Economy ETF has disclosed 49 total holdings in their latest SEC filings. Most recent portfolio value is calculated to be $ 47,297,991 USD. Actual Assets Under Management (AUM) is this value plus cash (which is not disclosed). BLCN - Siren Nasdaq NexGen Economy ETF’s top holdings are First American Funds Inc - First American Government Obligations Fund Class X (US:FGXXX) , Taiwan Semiconductor Manufacturing Company Limited - Depositary Receipt (Common Stock) (US:TSM) , Cipher Mining Inc. (US:CIFR) , Bitdeer Technologies Group (US:BTDR) , and Core Scientific, Inc. (US:CORZ) . BLCN - Siren Nasdaq NexGen Economy ETF’s new positions include Bitdeer Technologies Group (US:BTDR) , Hut 8 Corp. (US:HUT) , Circle Internet Group, Inc. (US:CRCL) , Galaxy Digital Inc. (US:GLXY) , and .
Top Increases This Quarter
We use the change in the portfolio allocation because this is the most meaningful metric. Changes can be due to trades or changes in share prices.
| Security | Shares (MM) |
Value (MM$) |
Portfolio % | ΔPortfolio % |
|---|---|---|---|---|
| 7.66 | 7.66 | 16.1123 | 8.5912 | |
| 0.18 | 2.04 | 4.2951 | 4.2951 | |
| 0.43 | 2.04 | 4.3027 | 2.7502 | |
| 0.01 | 2.11 | 4.4353 | 2.6983 | |
| 0.06 | 1.10 | 2.3197 | 2.3197 | |
| 0.00 | 0.90 | 1.8844 | 1.8844 | |
| 0.04 | 1.01 | 2.1194 | 1.1305 | |
| 0.00 | 0.90 | 1.8972 | 1.1289 | |
| 0.01 | 1.21 | 2.5553 | 0.8159 | |
| 0.23 | 1.02 | 2.1510 | 0.7752 |
Top Decreases This Quarter
We use the change in the portfolio allocation because this is the most meaningful metric. Changes can be due to trades or changes in share prices.
| Security | Shares (MM) |
Value (MM$) |
Portfolio % | ΔPortfolio % |
|---|---|---|---|---|
| 0.00 | 0.18 | 0.3872 | -4.0108 | |
| 0.00 | 0.36 | 0.7535 | -2.5668 | |
| 0.00 | 0.91 | 1.9163 | -1.9047 | |
| 0.00 | 0.20 | 0.4295 | -1.8022 | |
| 0.00 | 0.21 | 0.4519 | -1.3315 | |
| 0.00 | 1.45 | 3.0617 | -1.0626 | |
| 0.03 | 0.70 | 1.4759 | -0.8051 | |
| 0.04 | 0.46 | 0.9622 | -0.7744 | |
| 0.00 | 0.61 | 1.2883 | -0.7492 | |
| 0.00 | 0.56 | 1.1842 | -0.7012 |
13F and Fund Filings
This form was filed on 2025-08-25 for the reporting period 2025-06-30. Click the link icon to see the full transaction history.
Upgrade to unlock premium data and export to Excel ![]() .
.
| Security | Type | Avg Share Price | Shares (MM) |
ΔShares (%) |
ΔShares (%) |
Value ($MM) |
Portfolio (%) |
ΔPortfolio (%) |
|
|---|---|---|---|---|---|---|---|---|---|
| FGXXX / First American Funds Inc - First American Government Obligations Fund Class X | 7.66 | 141.80 | 7.66 | 141.82 | 16.1123 | 8.5912 | |||
| TSM / Taiwan Semiconductor Manufacturing Company Limited - Depositary Receipt (Common Stock) | 0.01 | 111.24 | 2.11 | 188.24 | 4.4353 | 2.6983 | |||
| CIFR / Cipher Mining Inc. | 0.43 | 50.53 | 2.04 | 213.02 | 4.3027 | 2.7502 | |||
| BTDR / Bitdeer Technologies Group | 0.18 | 2.04 | 4.2951 | 4.2951 | |||||
| CORZ / Core Scientific, Inc. | 0.10 | -47.90 | 1.75 | 22.84 | 3.6808 | 0.2985 | |||
| MSTR / Strategy Inc | 0.00 | -40.25 | 1.45 | -16.24 | 3.0617 | -1.0626 | |||
| XYZ / Block, Inc. | 0.02 | 21.82 | 1.41 | 52.32 | 2.9663 | 0.7681 | |||
| NVDA / NVIDIA Corporation | 0.01 | -0.11 | 1.27 | 45.59 | 2.6756 | 0.6016 | |||
| QCOM / QUALCOMM Incorporated | 0.01 | 59.93 | 1.21 | 65.85 | 2.5553 | 0.8159 | |||
| CUBI / Customers Bancorp, Inc. | 0.02 | 22.89 | 1.19 | 43.81 | 2.4953 | 0.5367 | |||
| MARA / MARA Holdings, Inc. | 0.07 | 3.95 | 1.16 | 41.74 | 2.4387 | 0.4966 | |||
| ZOF / SBI Holdings, Inc. | 0.03 | -9.30 | 1.11 | 19.31 | 2.3289 | 0.1256 | |||
| HUT / Hut 8 Corp. | 0.06 | 1.10 | 2.3197 | 2.3197 | |||||
| WULF / TeraWulf Inc. | 0.23 | 9.99 | 1.02 | 76.51 | 2.1510 | 0.7752 | |||
| 9449 / GMO internet group, Inc. | 0.04 | 97.67 | 1.01 | 142.07 | 2.1194 | 1.1305 | |||
| MA / Mastercard Incorporated | 0.00 | 13.40 | 0.97 | 16.19 | 2.0412 | 0.0595 | |||
| V / Visa Inc. | 0.00 | 11.18 | 0.95 | 12.53 | 2.0055 | -0.0041 | |||
| MSFT / Microsoft Corporation | 0.00 | -27.68 | 0.92 | -4.18 | 1.9335 | -0.3440 | |||
| IBM / International Business Machines Corporation | 0.00 | -52.25 | 0.91 | -43.41 | 1.9163 | -1.9047 | |||
| TXN / Texas Instruments Incorporated | 0.00 | 141.22 | 0.90 | 178.95 | 1.8972 | 1.1289 | |||
| ACN / Accenture plc | 0.00 | -9.77 | 0.90 | -13.58 | 1.8890 | -0.5778 | |||
| CRCL / Circle Internet Group, Inc. | 0.00 | 0.90 | 1.8844 | 1.8844 | |||||
| SAP / SAP SE - Depositary Receipt (Common Stock) | 0.00 | -22.23 | 0.83 | -11.95 | 1.7376 | -0.4885 | |||
| GS / The Goldman Sachs Group, Inc. | 0.00 | -9.06 | 0.80 | 17.78 | 1.6742 | 0.0703 | |||
| NDAQ / Nasdaq, Inc. | 0.01 | -12.78 | 0.72 | 2.87 | 1.5123 | -0.1481 | |||
| BLK / BlackRock, Inc. | 0.00 | -8.59 | 0.71 | 1.28 | 1.5038 | -0.1712 | |||
| HPE / Hewlett Packard Enterprise Company | 0.03 | -44.89 | 0.70 | -26.98 | 1.4759 | -0.8051 | |||
| MU / Micron Technology, Inc. | 0.01 | -28.03 | 0.70 | 2.04 | 1.4723 | -0.1556 | |||
| NT5 / NTT DATA Group Corporation | 0.02 | -46.75 | 0.68 | -17.32 | 1.4286 | -0.5210 | |||
| CLSK / CleanSpark, Inc. | 0.06 | -48.56 | 0.68 | -15.52 | 1.4207 | -0.4787 | |||
| PYPL / PayPal Holdings, Inc. | 0.01 | -29.25 | 0.64 | -19.42 | 1.3378 | -0.5360 | |||
| CSCO / Cisco Systems, Inc. | 0.01 | -32.43 | 0.62 | -24.05 | 1.3035 | -0.6331 | |||
| ORCL / Oracle Corporation | 0.00 | -54.36 | 0.61 | -28.59 | 1.2883 | -0.7492 | |||
| AMD / Advanced Micro Devices, Inc. | 0.00 | -14.56 | 0.61 | 18.09 | 1.2776 | 0.0556 | |||
| AXP / American Express Company | 0.00 | -40.20 | 0.56 | -29.13 | 1.1842 | -0.7012 | |||
| BK / The Bank of New York Mellon Corporation | 0.01 | -9.03 | 0.55 | -1.26 | 1.1591 | -0.1648 | |||
| M1Z / Nu Holdings Ltd. | 0.04 | -44.80 | 0.51 | -26.12 | 1.0731 | -0.5647 | |||
| BIDU / Baidu, Inc. - Depositary Receipt (Common Stock) | 0.01 | 33.30 | 0.51 | 24.51 | 1.0692 | 0.0977 | |||
| RIOT / Riot Platforms, Inc. | 0.04 | -60.59 | 0.46 | -37.48 | 0.9622 | -0.7744 | |||
| BABA / Alibaba Group Holding Limited - Depositary Receipt (Common Stock) | 0.00 | 83.55 | 0.42 | 57.25 | 0.8919 | 0.2524 | |||
| JD / JD.com, Inc. - Depositary Receipt (Common Stock) | 0.01 | 53.21 | 0.38 | 21.61 | 0.7945 | 0.0571 | |||
| IREN / IREN Limited | 0.03 | -73.40 | 0.37 | -36.35 | 0.7707 | -0.5961 | |||
| HOOD / Robinhood Markets, Inc. | 0.00 | -88.61 | 0.36 | -74.37 | 0.7535 | -2.5668 | |||
| WMT / Walmart Inc. | 0.00 | -74.32 | 0.21 | -71.47 | 0.4519 | -1.3315 | |||
| JPM / JPMorgan Chase & Co. | 0.00 | -81.62 | 0.20 | -78.27 | 0.4295 | -1.8022 | |||
| COIN / Coinbase Global, Inc. | 0.00 | -95.12 | 0.18 | -90.06 | 0.3872 | -4.0108 | |||
| SIE / Siemens Aktiengesellschaft | 0.00 | -7.89 | 0.14 | 2.88 | 0.3022 | -0.0288 | |||
| PLUS / Plus500 Ltd. | 0.00 | -9.08 | 0.14 | 19.49 | 0.2987 | 0.0167 | |||
| GLXY / Galaxy Digital Inc. | 0.00 | 0.04 | 0.0748 | 0.0748 |