Basic Stats
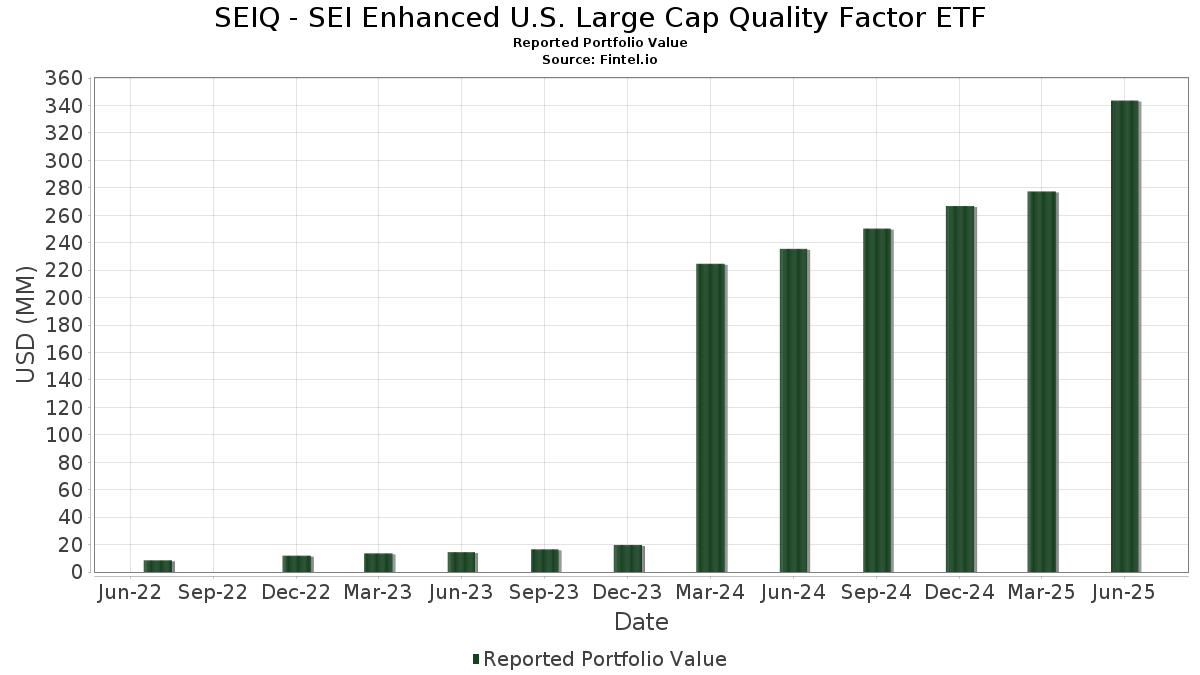
| Portfolio Value | $ 343,552,805 |
| Current Positions | 63 |
Latest Holdings, Performance, AUM (from 13F, 13D)
SEIQ - SEI Enhanced U.S. Large Cap Quality Factor ETF has disclosed 63 total holdings in their latest SEC filings. Most recent portfolio value is calculated to be $ 343,552,805 USD. Actual Assets Under Management (AUM) is this value plus cash (which is not disclosed). SEIQ - SEI Enhanced U.S. Large Cap Quality Factor ETF’s top holdings are Microsoft Corporation (US:MSFT) , Apple Inc. (US:AAPL) , Meta Platforms, Inc. (US:META) , Alphabet Inc. (US:GOOG) , and NVIDIA Corporation (US:NVDA) . SEIQ - SEI Enhanced U.S. Large Cap Quality Factor ETF’s new positions include eBay Inc. (US:EBAY) , Zoetis Inc. (US:ZTS) , Deckers Outdoor Corporation (US:DECK) , Etsy, Inc. (US:ETSY) , and Synopsys, Inc. (US:SNPS) .
Top Increases This Quarter
We use the change in the portfolio allocation because this is the most meaningful metric. Changes can be due to trades or changes in share prices.
| Security | Shares (MM) |
Value (MM$) |
Portfolio % | ΔPortfolio % |
|---|---|---|---|---|
| 0.05 | 25.61 | 7.3830 | 1.8648 | |
| 0.03 | 19.49 | 5.6209 | 1.2128 | |
| 0.08 | 12.19 | 3.5149 | 0.9175 | |
| 0.04 | 2.62 | 0.7542 | 0.7542 | |
| 0.02 | 7.72 | 2.2272 | 0.7457 | |
| 0.02 | 2.39 | 0.6877 | 0.6877 | |
| 0.02 | 7.98 | 2.3002 | 0.6539 | |
| 0.09 | 16.47 | 4.7498 | 0.6523 | |
| 0.00 | 12.05 | 3.4753 | 0.4389 | |
| 0.01 | 1.50 | 0.4324 | 0.4324 |
Top Decreases This Quarter
We use the change in the portfolio allocation because this is the most meaningful metric. Changes can be due to trades or changes in share prices.
| Security | Shares (MM) |
Value (MM$) |
Portfolio % | ΔPortfolio % |
|---|---|---|---|---|
| 0.03 | 2.38 | 0.6857 | -2.6222 | |
| 0.00 | 0.59 | 0.1688 | -2.2607 | |
| 0.02 | 2.44 | 0.7049 | -1.5905 | |
| 0.11 | 21.79 | 6.2826 | -1.0177 | |
| 0.01 | 1.59 | 0.4582 | -0.6121 | |
| 0.01 | 7.36 | 2.1214 | -0.4821 | |
| 0.01 | 2.66 | 0.7679 | -0.4573 | |
| 0.06 | 8.86 | 2.5553 | -0.4134 | |
| 0.05 | 8.58 | 2.4739 | -0.3525 | |
| 0.05 | 7.84 | 2.2593 | -0.3193 |
13F and Fund Filings
This form was filed on 2025-08-28 for the reporting period 2025-06-30. Click the link icon to see the full transaction history.
Upgrade to unlock premium data and export to Excel ![]() .
.
| Security | Type | Avg Share Price | Shares (MM) |
ΔShares (%) |
ΔShares (%) |
Value ($MM) |
Portfolio (%) |
ΔPortfolio (%) |
|
|---|---|---|---|---|---|---|---|---|---|
| MSFT / Microsoft Corporation | 0.05 | 25.44 | 25.61 | 66.22 | 7.3830 | 1.8648 | |||
| AAPL / Apple Inc. | 0.11 | 15.75 | 21.79 | 6.91 | 6.2826 | -1.0177 | |||
| META / Meta Platforms, Inc. | 0.03 | 23.70 | 19.49 | 58.42 | 5.6209 | 1.2128 | |||
| GOOG / Alphabet Inc. | 0.09 | 26.83 | 16.47 | 44.01 | 4.7498 | 0.6523 | |||
| NVDA / NVIDIA Corporation | 0.08 | 15.33 | 12.19 | 68.11 | 3.5149 | 0.9175 | |||
| PM / Philip Morris International Inc. | 0.07 | 12.69 | 12.15 | 29.31 | 3.5044 | 0.1375 | |||
| BKNG / Booking Holdings Inc. | 0.00 | 13.15 | 12.05 | 42.20 | 3.4753 | 0.4389 | |||
| V / Visa Inc. | 0.03 | 16.41 | 11.32 | 17.94 | 3.2647 | -0.1744 | |||
| JNJ / Johnson & Johnson | 0.06 | 16.10 | 8.86 | 6.94 | 2.5553 | -0.4134 | |||
| PG / The Procter & Gamble Company | 0.05 | 16.32 | 8.58 | 8.73 | 2.4739 | -0.3525 | |||
| QCOM / QUALCOMM Incorporated | 0.05 | 22.76 | 8.27 | 27.27 | 2.3845 | 0.0570 | |||
| MNST / Monster Beverage Corporation | 0.13 | 16.29 | 8.21 | 24.47 | 2.3670 | 0.0046 | |||
| VRSN / VeriSign, Inc. | 0.03 | 15.70 | 8.09 | 31.62 | 2.3319 | 0.1309 | |||
| ADBE / Adobe Inc. | 0.02 | 72.08 | 7.98 | 73.60 | 2.3002 | 0.6539 | |||
| MO / Altria Group, Inc. | 0.14 | 15.52 | 7.95 | 12.84 | 2.2937 | -0.2315 | |||
| YUM / Yum! Brands, Inc. | 0.05 | 15.59 | 7.84 | 8.85 | 2.2593 | -0.3193 | |||
| MCO / Moody's Corporation | 0.02 | 73.40 | 7.72 | 86.80 | 2.2272 | 0.7457 | |||
| CL / Colgate-Palmolive Company | 0.08 | 16.40 | 7.45 | 12.93 | 2.1485 | -0.2152 | |||
| MA / Mastercard Incorporated | 0.01 | -1.26 | 7.36 | 1.22 | 2.1214 | -0.4821 | |||
| TJX / The TJX Companies, Inc. | 0.06 | 15.70 | 7.36 | 17.30 | 2.1212 | -0.1253 | |||
| EA / Electronic Arts Inc. | 0.05 | 16.21 | 7.23 | 28.43 | 2.0841 | 0.0679 | |||
| ITW / Illinois Tool Works Inc. | 0.03 | 22.43 | 6.97 | 22.06 | 2.0085 | -0.0358 | |||
| GWW / W.W. Grainger, Inc. | 0.01 | 15.61 | 6.92 | 21.74 | 1.9943 | -0.0407 | |||
| IT / Gartner, Inc. | 0.02 | 53.65 | 6.49 | 47.99 | 1.8725 | 0.3004 | |||
| MSI / Motorola Solutions, Inc. | 0.01 | 16.48 | 6.20 | 11.87 | 1.7883 | -0.1978 | |||
| FFIV / F5, Inc. | 0.02 | 14.82 | 5.19 | 26.92 | 1.4954 | 0.0316 | |||
| VRTX / Vertex Pharmaceuticals Incorporated | 0.01 | 15.04 | 5.13 | 5.65 | 1.4780 | -0.2602 | |||
| DPZ / Domino's Pizza, Inc. | 0.01 | 15.13 | 4.90 | 12.93 | 1.4129 | -0.1417 | |||
| GGG / Graco Inc. | 0.05 | 35.01 | 4.44 | 38.98 | 1.2800 | 0.1359 | |||
| CSCO / Cisco Systems, Inc. | 0.05 | 15.80 | 3.63 | 30.21 | 1.0466 | 0.0479 | |||
| INTU / Intuit Inc. | 0.00 | -7.55 | 3.60 | 18.60 | 1.0372 | -0.0493 | |||
| MCD / McDonald's Corporation | 0.01 | 15.67 | 3.60 | 8.18 | 1.0371 | -0.1538 | |||
| MSCI / MSCI Inc. | 0.01 | 4.04 | 3.23 | 6.12 | 0.9299 | -0.1589 | |||
| GOOGL / Alphabet Inc. | 0.02 | 14.74 | 2.76 | 30.74 | 0.7949 | 0.0396 | |||
| NVR / NVR, Inc. | 0.00 | 15.72 | 2.72 | 17.98 | 0.7837 | -0.0415 | |||
| MTD / Mettler-Toledo International Inc. | 0.00 | 15.27 | 2.70 | 14.63 | 0.7773 | -0.0649 | |||
| VRSK / Verisk Analytics, Inc. | 0.01 | -25.61 | 2.66 | -22.13 | 0.7679 | -0.4573 | |||
| EBAY / eBay Inc. | 0.04 | 2.62 | 0.7542 | 0.7542 | |||||
| HRB / H&R Block, Inc. | 0.05 | 16.23 | 2.54 | 16.18 | 0.7331 | -0.0508 | |||
| KMB / Kimberly-Clark Corporation | 0.02 | -57.91 | 2.44 | -61.85 | 0.7049 | -1.5905 | |||
| ZTS / Zoetis Inc. | 0.02 | 2.39 | 0.6877 | 0.6877 | |||||
| ORLY / O'Reilly Automotive, Inc. | 0.03 | 309.32 | 2.38 | -74.25 | 0.6857 | -2.6222 | |||
| FDS / FactSet Research Systems Inc. | 0.00 | 16.06 | 2.17 | 14.20 | 0.6264 | -0.0552 | |||
| AMZN / Amazon.com, Inc. | 0.01 | 15.79 | 1.96 | 33.54 | 0.5638 | 0.0392 | |||
| ADSK / Autodesk, Inc. | 0.01 | 86.59 | 1.90 | 120.63 | 0.5491 | 0.2399 | |||
| PAYX / Paychex, Inc. | 0.01 | -43.59 | 1.59 | -46.82 | 0.4582 | -0.6121 | |||
| LII / Lennox International Inc. | 0.00 | 309.42 | 1.57 | 318.67 | 0.4527 | 0.3183 | |||
| DECK / Deckers Outdoor Corporation | 0.01 | 1.50 | 0.4324 | 0.4324 | |||||
| FICO / Fair Isaac Corporation | 0.00 | -16.55 | 1.48 | -17.28 | 0.4280 | -0.2148 | |||
| IDXX / IDEXX Laboratories, Inc. | 0.00 | 12.51 | 1.42 | 43.74 | 0.4104 | 0.0556 | |||
| RHI / Robert Half Inc. | 0.03 | 15.85 | 1.34 | -12.78 | 0.3858 | -0.1640 | |||
| NTAP / NetApp, Inc. | 0.01 | 11.83 | 1.28 | 35.63 | 0.3689 | 0.0310 | |||
| FAST / Fastenal Company | 0.03 | 40.64 | 1.25 | -23.83 | 0.3605 | -0.2275 | |||
| ETSY / Etsy, Inc. | 0.02 | 1.21 | 0.3478 | 0.3478 | |||||
| MANH / Manhattan Associates, Inc. | 0.01 | 15.49 | 1.16 | 31.82 | 0.3359 | 0.0193 | |||
| FTNT / Fortinet, Inc. | 0.01 | 78.39 | 1.11 | 96.11 | 0.3196 | 0.1170 | |||
| ABNB / Airbnb, Inc. | 0.01 | 10.53 | 1.04 | 22.39 | 0.3013 | -0.0044 | |||
| CTAS / Cintas Corporation | 0.00 | -45.71 | 0.97 | -41.15 | 0.2802 | -0.3111 | |||
| SNPS / Synopsys, Inc. | 0.00 | 0.88 | 0.2528 | 0.2528 | |||||
| EXEL / Exelixis, Inc. | 0.02 | 0.76 | 0.2184 | 0.2184 | |||||
| HD / The Home Depot, Inc. | 0.00 | 14.22 | 0.59 | 14.17 | 0.1698 | -0.0148 | |||
| CDNS / Cadence Design Systems, Inc. | 0.00 | -91.58 | 0.59 | -90.43 | 0.1688 | -2.2607 | |||
| UI / Ubiquiti Inc. | 0.00 | 0.32 | 0.0933 | 0.0933 |