Basic Stats
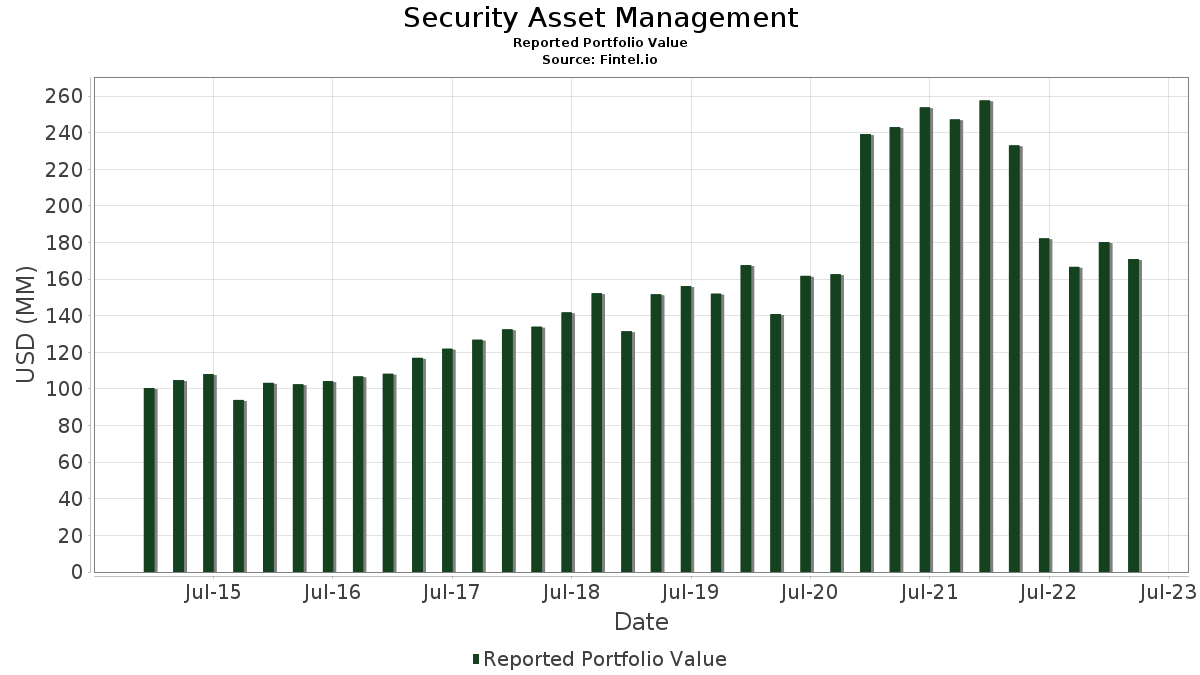
| Portfolio Value | $ 170,929,770 |
| Current Positions | 76 |
Latest Holdings, Performance, AUM (from 13F, 13D)
Security Asset Management has disclosed 76 total holdings in their latest SEC filings. Most recent portfolio value is calculated to be $ 170,929,770 USD. Actual Assets Under Management (AUM) is this value plus cash (which is not disclosed). Security Asset Management’s top holdings are Apple Inc. (US:AAPL) , JPMorgan Chase & Co. (US:JPM) , Danaher Corporation (US:DHR) , Microsoft Corporation (US:MSFT) , and Mastercard Incorporated (US:MA) . Security Asset Management’s new positions include Vanguard Bond Index Funds - Vanguard Bond Index Fund Total Bond Market Index Fund (US:VBMFX) , BlackRock Innovation and Growth Term Trust (US:BIGZ) , iShares Trust - iShares 3-7 Year Treasury Bond ETF (US:IEI) , Vanguard Scottsdale Funds - Vanguard Mortgage-Backed Securities ETF (US:VMBS) , and iShares Trust - iShares 7-10 Year Treasury Bond ETF (US:IEF) .
Top Increases This Quarter
We use the change in the portfolio allocation because this is the most meaningful metric. Changes can be due to trades or changes in share prices.
| Security | Shares (MM) |
Value (MM$) |
Portfolio % | ΔPortfolio % |
|---|---|---|---|---|
| 0.11 | 18.57 | 10.8651 | 2.6503 | |
| 0.02 | 1.64 | 0.9610 | 0.9610 | |
| 0.02 | 1.88 | 1.0974 | 0.8655 | |
| 1.29 | 0.7531 | 0.7531 | ||
| 1.24 | 0.7265 | 0.7265 | ||
| 0.02 | 5.95 | 3.4790 | 0.5482 | |
| 0.11 | 0.86 | 0.5042 | 0.5042 | |
| 0.01 | 4.04 | 2.3652 | 0.4723 | |
| 0.05 | 4.73 | 2.7679 | 0.3905 | |
| 0.01 | 0.62 | 0.3614 | 0.3614 |
Top Decreases This Quarter
We use the change in the portfolio allocation because this is the most meaningful metric. Changes can be due to trades or changes in share prices.
| Security | Shares (MM) |
Value (MM$) |
Portfolio % | ΔPortfolio % |
|---|---|---|---|---|
| 0.00 | 0.00 | -1.7399 | ||
| 0.00 | 0.00 | -0.8364 | ||
| 0.03 | 6.85 | 4.0098 | -0.7228 | |
| 0.00 | 0.00 | -0.6629 | ||
| 0.02 | 2.86 | 1.6714 | -0.6396 | |
| 0.00 | 0.00 | -0.4881 | ||
| 0.02 | 5.65 | 3.3041 | -0.4400 | |
| 0.02 | 3.14 | 1.8374 | -0.4329 | |
| 0.02 | 3.47 | 2.0319 | -0.4296 | |
| 0.01 | 4.93 | 2.8837 | -0.4147 |
13F and Fund Filings
This form was filed on 2023-05-12 for the reporting period 2023-03-31. Click the link icon to see the full transaction history.
Upgrade to unlock premium data and export to Excel ![]() .
.
| Security | Type | Avg Share Price | Shares (MM) |
ΔShares (%) |
ΔShares (%) |
Value ($MM) |
Portfolio (%) |
ΔPortfolio (%) |
|
|---|---|---|---|---|---|---|---|---|---|
| AAPL / Apple Inc. | 0.11 | -1.15 | 18.57 | 25.45 | 10.8651 | 2.6503 | |||
| JPM / JPMorgan Chase & Co. | 0.06 | -9.14 | 7.29 | -11.70 | 4.2644 | -0.3169 | |||
| DHR / Danaher Corporation | 0.03 | -15.36 | 6.85 | -19.64 | 4.0098 | -0.7228 | |||
| MSFT / Microsoft Corporation | 0.02 | -6.33 | 5.95 | 12.59 | 3.4790 | 0.5482 | |||
| MA / Mastercard Incorporated | 0.02 | -19.90 | 5.65 | -16.29 | 3.3041 | -0.4400 | |||
| ROP / Roper Technologies, Inc. | 0.01 | -12.15 | 5.21 | -10.40 | 3.0491 | -0.1790 | |||
| C.WSA / Citigroup, Inc. | 0.01 | -12.17 | 4.93 | -17.06 | 2.8837 | -0.4147 | |||
| AMZN / Amazon.com, Inc. | 0.05 | -10.19 | 4.73 | 10.43 | 2.7679 | 0.3905 | |||
| GOOGL / Alphabet Inc. | 0.04 | -16.05 | 4.68 | -1.62 | 2.7367 | 0.0985 | |||
| DOV / Dover Corporation | 0.03 | -22.32 | 4.07 | -12.85 | 2.3813 | -0.2103 | |||
| CME / CME Group Inc. | 0.02 | -18.80 | 4.07 | -7.52 | 2.3800 | -0.0613 | |||
| WST / West Pharmaceutical Services, Inc. | 0.01 | -19.49 | 4.04 | 18.53 | 2.3652 | 0.4723 | |||
| BRK.B / Berkshire Hathaway Inc. | 0.01 | -10.82 | 3.99 | -10.86 | 2.3342 | -0.1497 | |||
| GOOGL / Alphabet Inc. | 0.04 | -5.77 | 3.79 | 10.78 | 2.2187 | 0.3189 | |||
| MKL / Markel Group Inc. | 0.00 | -1.45 | 3.65 | -4.45 | 2.1359 | 0.0156 | |||
| MSCI / MSCI Inc. | 0.01 | -18.11 | 3.59 | -1.45 | 2.1016 | 0.0786 | |||
| JNJ / Johnson & Johnson | 0.02 | 2.05 | 3.51 | -10.47 | 2.0557 | -0.1219 | |||
| V / Visa Inc. | 0.02 | -22.08 | 3.48 | -15.44 | 2.0374 | -0.2480 | |||
| AMT / American Tower Corporation | 0.02 | -18.82 | 3.47 | -21.69 | 2.0319 | -0.4296 | |||
| ZTS / Zoetis Inc. | 0.02 | -19.25 | 3.44 | -8.29 | 2.0123 | -0.0691 | |||
| HEI / HEICO Corporation | 0.02 | -15.25 | 3.17 | -5.65 | 1.8568 | -0.0100 | |||
| AME / AMETEK, Inc. | 0.02 | -26.20 | 3.14 | -23.25 | 1.8374 | -0.4329 | |||
| IDXX / IDEXX Laboratories, Inc. | 0.01 | -29.94 | 3.09 | -14.12 | 1.8075 | -0.1889 | |||
| CPRT / Copart, Inc. | 0.04 | -19.31 | 2.91 | -0.34 | 1.7011 | 0.0822 | |||
| AWK / American Water Works Company, Inc. | 0.02 | -28.62 | 2.86 | -31.41 | 1.6714 | -0.6396 | |||
| TMO / Thermo Fisher Scientific Inc. | 0.00 | -16.23 | 2.84 | -12.34 | 1.6590 | -0.1358 | |||
| ABBV / AbbVie Inc. | 0.02 | 0.22 | 2.43 | -1.14 | 1.4211 | 0.0572 | |||
| PAYC / Paycom Software, Inc. | 0.01 | -19.30 | 2.41 | -20.94 | 1.4095 | -0.2815 | |||
| ECL / Ecolab Inc. | 0.01 | -26.21 | 2.40 | -16.07 | 1.4025 | -0.1828 | |||
| TYL / Tyler Technologies, Inc. | 0.01 | -27.25 | 2.34 | -19.99 | 1.3675 | -0.2535 | |||
| HD / The Home Depot, Inc. | 0.01 | -10.09 | 2.26 | -16.01 | 1.3201 | -0.1705 | |||
| TDY / Teledyne Technologies Incorporated | 0.01 | -21.38 | 2.25 | -12.06 | 1.3138 | -0.1032 | |||
| ABT / Abbott Laboratories | 0.02 | -6.33 | 2.12 | -13.61 | 1.2405 | -0.1216 | |||
| TW / Tradeweb Markets Inc. | 0.02 | 268.77 | 1.88 | 349.64 | 1.0974 | 0.8655 | |||
| VEEV / Veeva Systems Inc. | 0.01 | -17.97 | 1.77 | -6.56 | 1.0333 | -0.0159 | |||
| VBMFX / Vanguard Bond Index Funds - Vanguard Bond Index Fund Total Bond Market Index Fund | 0.02 | 1.64 | 0.9610 | 0.9610 | |||||
| BX / Blackstone Inc. | 0.02 | -29.39 | 1.57 | -16.42 | 0.9176 | -0.1236 | |||
| INTU / Intuit Inc. | 0.00 | -32.34 | 1.38 | -22.52 | 0.8076 | -0.1808 | |||
| XOM / Exxon Mobil Corporation | 0.01 | 12.63 | 1.30 | 12.05 | 0.7618 | 0.1165 | |||
| IBDP / iShares Trust - iShares iBonds Dec 2024 Term Corporate ETF | 1.29 | 0.7531 | 0.7531 | ||||||
| IBDO / iShares Trust - iShares iBonds Dec 2023 Term Corporate ETF | 1.24 | 0.7265 | 0.7265 | ||||||
| CDNS / Cadence Design Systems, Inc. | 0.01 | 15.93 | 1.24 | 51.53 | 0.7247 | 0.2713 | |||
| NVDA / NVIDIA Corporation | 0.00 | -39.60 | 1.18 | 14.83 | 0.6890 | 0.1197 | |||
| PG / The Procter & Gamble Company | 0.01 | -21.66 | 1.08 | -23.15 | 0.6333 | -0.1483 | |||
| MRK / Merck & Co., Inc. | 0.01 | -27.03 | 0.94 | -29.99 | 0.5517 | -0.1962 | |||
| CVX / Chevron Corporation | 0.01 | 21.06 | 0.93 | 10.07 | 0.5438 | 0.0751 | |||
| ISRG / Intuitive Surgical, Inc. | 0.00 | 5.54 | 0.90 | 1.58 | 0.5268 | 0.0350 | |||
| BIGZ / BlackRock Innovation and Growth Term Trust | 0.11 | 0.86 | 0.5042 | 0.5042 | |||||
| PFE / Pfizer Inc. | 0.02 | -7.49 | 0.73 | -26.36 | 0.4267 | -0.1228 | |||
| AMGN / Amgen Inc. | 0.00 | -1.15 | 0.73 | -8.92 | 0.4243 | -0.0180 | |||
| GPC / Genuine Parts Company | 0.00 | 0.00 | 0.64 | -3.59 | 0.3772 | 0.0061 | |||
| BMY / Bristol-Myers Squibb Company | 0.01 | 20.31 | 0.64 | 15.76 | 0.3743 | 0.0679 | |||
| COST / Costco Wholesale Corporation | 0.00 | -50.80 | 0.63 | -46.49 | 0.3660 | -0.2823 | |||
| IEI / iShares Trust - iShares 3-7 Year Treasury Bond ETF | 0.01 | 0.62 | 0.3614 | 0.3614 | |||||
| VMBS / Vanguard Scottsdale Funds - Vanguard Mortgage-Backed Securities ETF | 0.01 | 0.60 | 0.3513 | 0.3513 | |||||
| IEF / iShares Trust - iShares 7-10 Year Treasury Bond ETF | 0.01 | 0.58 | 0.3392 | 0.3392 | |||||
| BKNG / Booking Holdings Inc. | 0.00 | 42.00 | 0.56 | 86.75 | 0.3305 | 0.1628 | |||
| MDT / Medtronic plc | 0.01 | 0.00 | 0.53 | 12.92 | 0.3119 | 0.0499 | |||
| TGT / Target Corporation | 0.00 | -17.56 | 0.51 | -8.48 | 0.2971 | -0.0105 | |||
| NVS / Novartis AG - Depositary Receipt (Common Stock) | 0.01 | 0.00 | 0.48 | 1.26 | 0.2819 | 0.0182 | |||
| BRK.A / Berkshire Hathaway Inc. | 0.00 | 0.00 | 0.47 | -0.64 | 0.2724 | 0.0123 | |||
| LIN / Linde plc | 0.00 | 0.00 | 0.44 | 9.14 | 0.2587 | 0.0335 | |||
| VZ / Verizon Communications Inc. | 0.01 | -2.47 | 0.44 | -3.52 | 0.2563 | 0.0038 | |||
| ADX / Adams Diversified Equity Fund, Inc. | 0.03 | 0.42 | 0.2472 | 0.2472 | |||||
| GS.PRK / The Goldman Sachs Group, Inc. - Preferred Stock | 0.00 | 11.57 | 0.38 | 6.18 | 0.2215 | 0.0239 | |||
| AMAT / Applied Materials, Inc. | 0.00 | 0.00 | 0.36 | 26.04 | 0.2126 | 0.0527 | |||
| KO / The Coca-Cola Company | 0.01 | 0.00 | 0.36 | -2.45 | 0.2096 | 0.0057 | |||
| CSCO / Cisco Systems, Inc. | 0.01 | 0.08 | 0.33 | 9.90 | 0.1950 | 0.0266 | |||
| HON / Honeywell International Inc. | 0.00 | 0.12 | 0.33 | -10.68 | 0.1908 | -0.0120 | |||
| PM / Philip Morris International Inc. | 0.00 | 35.11 | 0.32 | 29.80 | 0.1866 | 0.0502 | |||
| SBAC / SBA Communications Corporation | 0.00 | 12.79 | 0.28 | 5.20 | 0.1657 | 0.0160 | |||
| AES / The AES Corporation | 0.01 | 0.00 | 0.26 | -16.29 | 0.1507 | -0.0200 | |||
| TROW / T. Rowe Price Group, Inc. | 0.00 | 0.00 | 0.25 | 3.28 | 0.1480 | 0.0123 | |||
| WFC / Wells Fargo & Company | 0.01 | 0.00 | 0.25 | -9.56 | 0.1443 | -0.0069 | |||
| EMR / Emerson Electric Co. | 0.00 | -17.24 | 0.21 | -24.82 | 0.1224 | -0.0322 | |||
| UL / Unilever PLC - Depositary Receipt (Common Stock) | 0.00 | 0.21 | 0.1221 | 0.1221 | |||||
| ILMN / Illumina, Inc. | 0.00 | -100.00 | 0.00 | -100.00 | -0.4881 | ||||
| BAC.PRB / Bank of America Corporation - Preferred Stock | 0.00 | -100.00 | 0.00 | -100.00 | -0.1645 | ||||
| FRC / First Republic Bank | 0.00 | -100.00 | 0.00 | -100.00 | -0.6629 | ||||
| STE / STERIS plc | 0.00 | -100.00 | 0.00 | -100.00 | -0.8364 | ||||
| PEP / PepsiCo, Inc. | 0.00 | -100.00 | 0.00 | -100.00 | -0.1585 | ||||
| EQIX / Equinix, Inc. | 0.00 | -100.00 | 0.00 | -100.00 | -1.7399 |